Power Generation
Can be used to compare active power, reactive power, or similar numerical values from different generating units.
EOS SCADA • LIVE BAR CHART • PROCESS DATA • COMPARATIVE DISPLAY
BAR_CHART is a user control used to display current values of different process variables as live bar charts on EOS SCADA screens. The Bar Data Items defined within the control can be displayed as individual bars on the chart.
The size of each bar provides a visual representation of the corresponding data value. This makes it easier to compare different values within the same chart area. Values can be displayed as numbers or percentages, if desired. Visual properties such as descriptions, labels, tooltips, colors, gradients, borders, and shadows can also be configured separately.

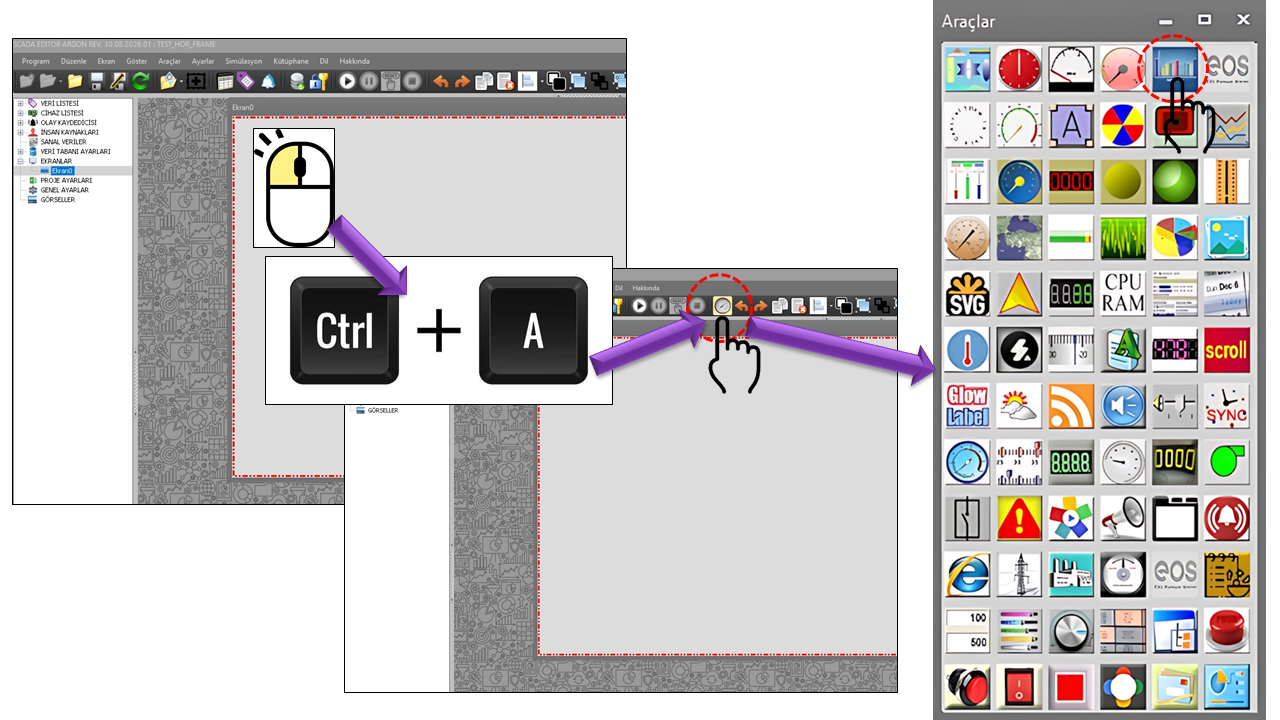
BAR_CHART allows multiple numerical process values to be displayed as bars
within the same chart area on SCADA screens. The control's core data structure
is the collection of Bar Data Items of type
BAR_DATA_COLLECTION[]. Each data item can be represented by a bar
corresponding to its value within the chart.
The primary purpose of this control is to present the current states of different data points in a single visual area, making them easy to compare. For example, power values from different generating units, flow rates from different pumps, levels in different tanks, or instantaneous values from different load groups can be displayed on the same chart.
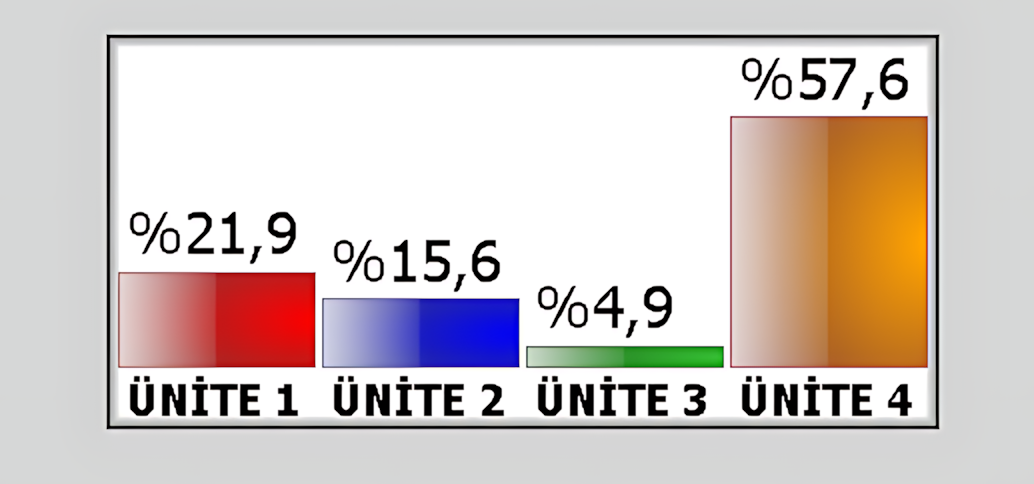
Unlike a trend chart designed to display historical changes over time, BAR_CHART can be used to quickly assess the relative magnitudes of multiple values at the same point in time. It is therefore a suitable visual tool, particularly for displaying and comparing instantaneous states.
Basic approach: BAR_CHART displays different SCADA data values as bars within the same chart area. The control's appearance and the way values are presented can be configured using the properties defined in the source code.
When configuring BAR_CHART, first define the control's general operating properties and data items. Then configure the chart sizing, bar drawing style, labels, value display, and visual effects.
The basic operating and appearance properties of the BAR_CHART control are defined by the parameters below. These properties are used to identify and update the control and configure its basic text and visual presentation.
Property table: Each row includes the technical property name, its EOS Turkish equivalent, default value, purpose, and typical application.
| Property | EOS Turkish Equivalent | Default | Purpose | Typical Application |
|---|---|---|---|---|
UCType |
Control Type | BAR_CHART |
Defines the type of user control. | Basic configuration where the BAR_CHART control is defined. |
UpdateInterval |
Update Interval | 1000 ms |
Specifies the control's update interval. | Charts where real-time SCADA data is refreshed periodically. |
DecimalPoint |
Decimal Places | 0 |
Specifies the number of decimal places used to display numerical values. | Displaying numerical values such as power, flow rate, level, and pressure. |
UCBackColor |
Control Background Color | White |
Specifies the control's background color. | Matching the chart area to the screen design. |
UCForeColor |
Control Text Color | Black |
Specifies the control's primary text color. | Controlling the appearance of general text on the chart. |
UCFont |
Control Font | Arial Narrow, 8.25 pt |
Specifies the control's primary font. | Adjusting the readability of general text displayed on the control. |
BarDataItems represents the collection of data items displayed
on the BAR_CHART. In the source code, this structure is defined as
BAR_DATA_COLLECTION[].
| Property | EOS Turkish Equivalent | Default | Purpose | Typical Application |
|---|---|---|---|---|
BarDataItems |
Bar Data Items | BAR_DATA_COLLECTION[] |
Represents the collection of bar data items to be displayed on the chart. | Displaying multiple SCADA data values on the same chart. |
Source code limitation:
The provided code excerpt does not include the internal properties of the
BAR_DATA_COLLECTION class. Therefore, this page does not provide
source-code-based details about the fields contained in each data item, how
data connections are established, or how the color and label settings of
individual data items are defined.
Current power values from different generating units can be compared within the same chart. Each unit's value is represented on the chart as a separate Bar Data Item.
This group defines the sizing of the chart area and the visual drawing style of the bars.
| Property | EOS Turkish Equivalent | Default | Purpose | Typical Application |
|---|---|---|---|---|
ChartSizingMode |
Chart Sizing Mode | Normal |
Specifies the chart's scaling behavior. | Using the chart with normal or automatic scaling behavior. |
ItemsDrawingMode |
Items Drawing Mode | Glass |
Specifies the visual drawing style of the bars. | Displaying bars in Glass, Rubber, or Solid style. |
DisplayBarTooltip |
Display Bar Tooltip | true |
Specifies whether tooltips associated with the bars are enabled. | Screens where users need to view additional information about chart bars. |
| ENUM | English |
|---|---|
Normal |
Normal |
Autoscale |
Autoscale |
| ENUM | English |
|---|---|
Glass |
Glass |
Rubber |
Rubber |
Solid |
Solid |
Labels can be enabled separately to make it easier to identify the bars on the chart. The label color and font can also be configured.
| Property | EOS Turkish Equivalent | Default | Purpose | Typical Application |
|---|---|---|---|---|
DisplayBarLabels |
Display Bar Labels | false |
Specifies whether bar labels are displayed. | Clearly identifying on the chart which data item each bar represents. |
LabelColor |
Label Color | Black |
Specifies the color of the bar labels. | Distinguishing labels from the chart background. |
LabelFont |
Label Font | Tahoma, 8 pt, Bold |
Specifies the font properties of the bar labels. | Adjusting label readability. |
This group can be used when explanatory text about the chart needs to be displayed on BAR_CHART. The description's visibility, text, color, and font can be configured independently.
| Property | EOS Turkish Equivalent | Default | Purpose | Typical Application |
|---|---|---|---|---|
DisplayDescription |
Display Description | false |
Specifies whether the chart description is displayed. | Identifying the chart's purpose or data group with a title or description. |
DescriptionText |
Description Text | "" |
Specifies the description text to be displayed. | Explaining to users what the chart represents. |
DescriptionColor |
Description Color | Black |
Specifies the color of the description text. | Matching the chart title to the screen design. |
DescriptionFont |
Description Font | Tahoma, 14 pt, Bold |
Specifies the font properties of the description text. | Adjusting the visual hierarchy of the chart title. |
Value settings determine whether the numerical information represented by the bars is displayed on the chart and how that information is presented.
| Property | EOS Turkish Equivalent | Default | Purpose | Typical Application |
|---|---|---|---|---|
DisplayValues |
Display Values | true |
Specifies whether the values represented by the bars are displayed. | Situations where operators need to see numerical values directly on the chart. |
ValuesMode |
Values Mode | Digit |
Specifies whether values are displayed as digits or percentages. | Displaying absolute process values or percentage-based comparisons. |
ValuesColor |
Values Color | Black |
Specifies the color of the value text displayed on the chart. | Improving the readability of value information. |
ValuesFont |
Values Font | Tahoma, 7 pt |
Specifies the font properties of the value text. | Adjusting the readability of bar values. |
| ENUM | English |
|---|---|
Percent |
Percent |
Digit |
Digit |
The visual appearance of the bars is determined by the Painting Mode. One of three options can be used: solid color, linear gradient, or radial gradient.
| Property | EOS Turkish Equivalent | Default | Purpose | Typical Application |
|---|---|---|---|---|
PaintingMode |
Painting Mode | Solidcolor |
Specifies how the bars are filled and painted. | Creating solid-color or gradient bar appearances. |
GradientColor1 |
Gradient Color 1 | White |
Specifies the first color used in the gradient. | Two-color gradient designs. |
GradientColor2 |
Gradient Color 2 | DimGray |
Specifies the second color used in the gradient. | Two-color gradient designs. |
| ENUM | English |
|---|---|
Lineargradient |
Linear Gradient |
Radialgradient |
Radial Gradient |
Solidcolor |
Solid Color |
Border properties determine whether a frame is displayed around the chart area or related visual elements, and define the appearance of that frame.
| Property | EOS Turkish Equivalent | Default | Purpose | Typical Application |
|---|---|---|---|---|
DisplayBorder |
Display Border | false |
Specifies whether the border is displayed. | Screens where the chart area needs a visible frame. |
BorderStyle |
Border Style | None |
Specifies the style of the border. | Configuring the border as a single-line or fixed 3D frame. |
BorderColor |
Border Color | Black |
Specifies the border color. | Matching the chart frame to the screen design. |
BorderWidth |
Border Width | 1 |
Specifies the border width. | Adjusting the visual thickness of the chart frame. |
| ENUM | English |
|---|---|
None |
None |
Fixedsingle |
Fixed Single |
Fixed3d |
Fixed 3D |
Shadow settings can be used to adjust the visual depth of chart elements. The available options include inner, outer, or combined shadows.
| Property | EOS Turkish Equivalent | Default | Purpose | Typical Application |
|---|---|---|---|---|
ShadowMode |
Shadow Mode | None |
Specifies whether a shadow is used and its direction. | Adjusting the visual depth of the chart and bars. |
WidthInner |
Inner Width | 5 |
Specifies the width of the inner shadow. | Configuring the inner shadow effect. |
WidthOuter |
Outer Width | 5 |
Specifies the width of the outer shadow. | Configuring the outer shadow effect. |
| ENUM | English |
|---|---|
None |
None |
Inner |
Inner |
Outer |
Outer |
Both |
Both |
The default value of the BAR_CHART UpdateInterval property is
1000 ms. This value defines the control's update interval. As the data items
used on the SCADA screen are updated, the bars on the chart are intended to
reflect their current values.
BAR_CHART can be used to monitor the active power values of four generating units simultaneously in a power plant. Each unit is represented on the chart as a separate Bar Data Item.
This arrangement helps operators quickly determine, within a single chart area, which unit currently has a higher or lower value than the others.
If the fill levels of multiple tanks need to be displayed as percentages,
the Percent option can be selected for ValuesMode.
The chart can then present the current fill levels of different tanks for
comparison.
BAR_CHART can be used to monitor similar or comparable numerical values from different process points on the same screen. The following examples illustrate the control's general usage.
Can be used to compare active power, reactive power, or similar numerical values from different generating units.
Flow rates in different lines or level values in different tanks can be displayed side by side in the same chart area.
Can be used to compare measurable values from groups of pumps, fans, compressors, or similar equipment on the same screen.
Can be used to compare the instantaneous magnitudes of different process variables of the same type within a single visual area.
When designing a BAR_CHART, visual interpretation is easier when the values being compared use the same or comparable scales. If values with different physical units must be displayed on the same chart, the scaling method and the way the values are explained to users should be considered separately.
Readability: When many bars are placed in the same chart area, sufficient space must be reserved for labels and value text. As the number of bars increases, the chart area, font size, and value display settings should be considered together.
Scale consistency: To ensure that bars can be meaningfully interpreted within the same chart, the selected scale and display method should be appropriate for all data items.
Note: The examples on this page explain the properties defined in the BAR_CHART source code in the context of general SCADA usage. No definitive behavior is specified for data connections or calculation algorithms that are not present in the supplied source code.
In industrial visualization applications, bar charts are used not only to represent numerical values graphically but also to compare multiple values. This approach is particularly useful on screens where operators need to recognize differences between values quickly.
Bar charts can be used to compare fill levels, production quantities, load values, equipment measurements, and similar process variables. Using value labels, scales, and descriptions on the chart helps users understand the relationship between numerical values and their visual magnitudes.
This general approach is consistent with the structure of BAR_CHART: the control can contain multiple Bar Data Items, and the bars' drawing style, value display, labels, and visual properties can be configured separately.
Research note: Industrial HMI documentation reviewed during internet research indicates that bar charts are commonly used to compare multiple numerical values, visually represent levels or quantities, and help operators quickly understand relationships between values. This information is used to explain BAR_CHART's applications in the context of general industrial visualization. Features not present in the BAR_CHART source code have not been attributed to the control itself.
| Group | Key Properties |
|---|---|
| General | UCType, UCName, UpdateInterval, DecimalPoint, UCBackColor, UCForeColor, UCFont |
| Bar | BarDataItems, ChartSizingMode, ItemsDrawingMode, DisplayBarTooltip |
| Labels | DisplayBarLabels, LabelColor, LabelFont |
| Description | DisplayDescription, DescriptionText, DescriptionColor, DescriptionFont |
| Values | DisplayValues, ValuesMode, ValuesColor, ValuesFont |
| Gradient | PaintingMode, GradientColor1, GradientColor2 |
| Border | DisplayBorder, BorderStyle, BorderColor, BorderWidth |
| Shadow | ShadowMode, WidthInner, WidthOuter |
BAR_CHART is a user control that can be used to display different process values as bar charts within the same visual area on EOS SCADA screens. Its basic structure is based on graphically presenting current values through multiple Bar Data Items.
Properties such as chart sizing, bar drawing style, labels, descriptions, value display, gradients, borders, and shadows allow the same control to be adapted to different screen designs. It provides a useful visual presentation, particularly on screens where current values from different units, equipment, or process points need to be monitored and compared.
Summary: BAR_CHART is designed to present different SCADA data values as live, comparable bar charts. The chart's appearance and value presentation can be configured in detail using the properties explicitly defined in the source code.

Free Software Download Center
Software for industrial data collection, monitoring, and analysis.

Technical Support
Software documentation, sample code, and practical technical information.
You can contact us regarding EOS software, technical documentation, or industrial data communication.