HEADER
Identifies what the displayed SCADA data represents, such as Active Power, Pressure, Temperature, or Reservoir Level.
EOS SCADA • ETIKET • LABEL • LIVE DATA • TITLE • VALUE • UNIT
LABEL is a specialized user control designed to display process data on EOS SCADA screens as simple, readable, and well-organized text blocks.
The control combines three essential information fields within a single visual structure: TITLE, live DATA received from SCADA, and the corresponding UNIT. This makes process values such as temperature, pressure, power, flow rate, level, voltage, and current easy to read on the screen.

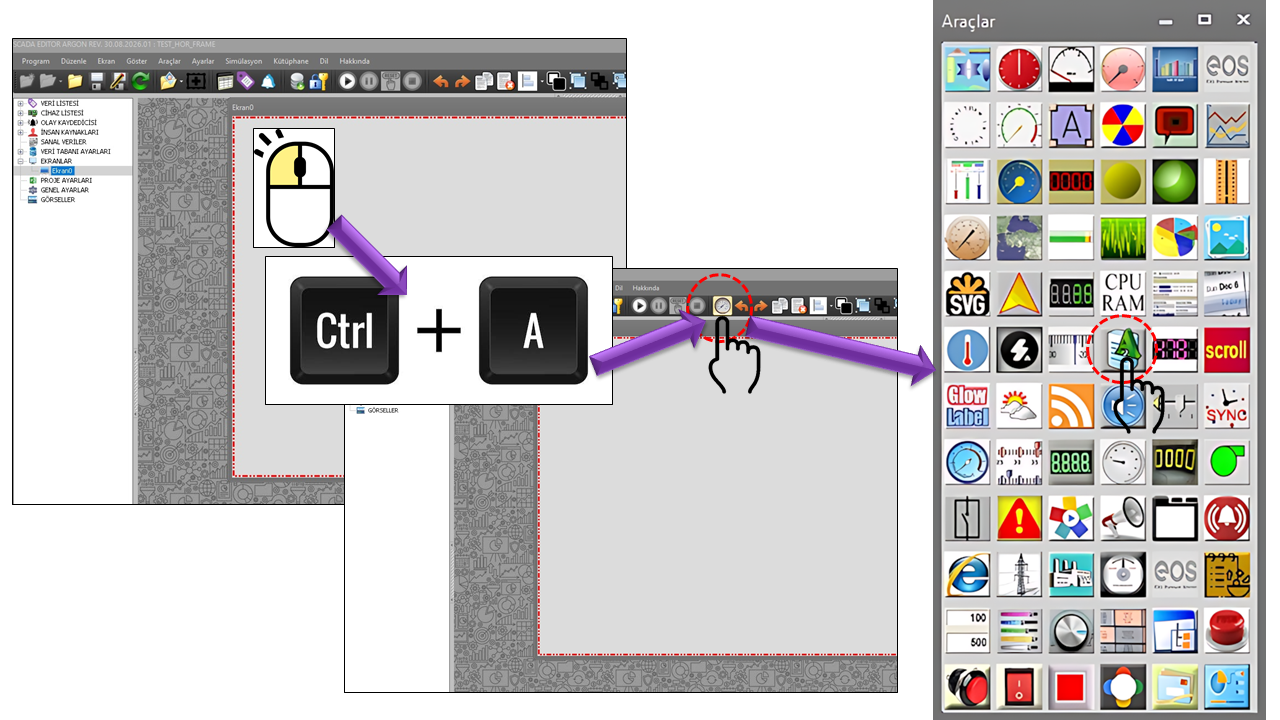
LABEL provides one of the most commonly needed ways to present information on SCADA screens within a single user control. Instead of displaying only the numerical value of a process variable, it presents the title identifying that value and its engineering unit in the same visual block.
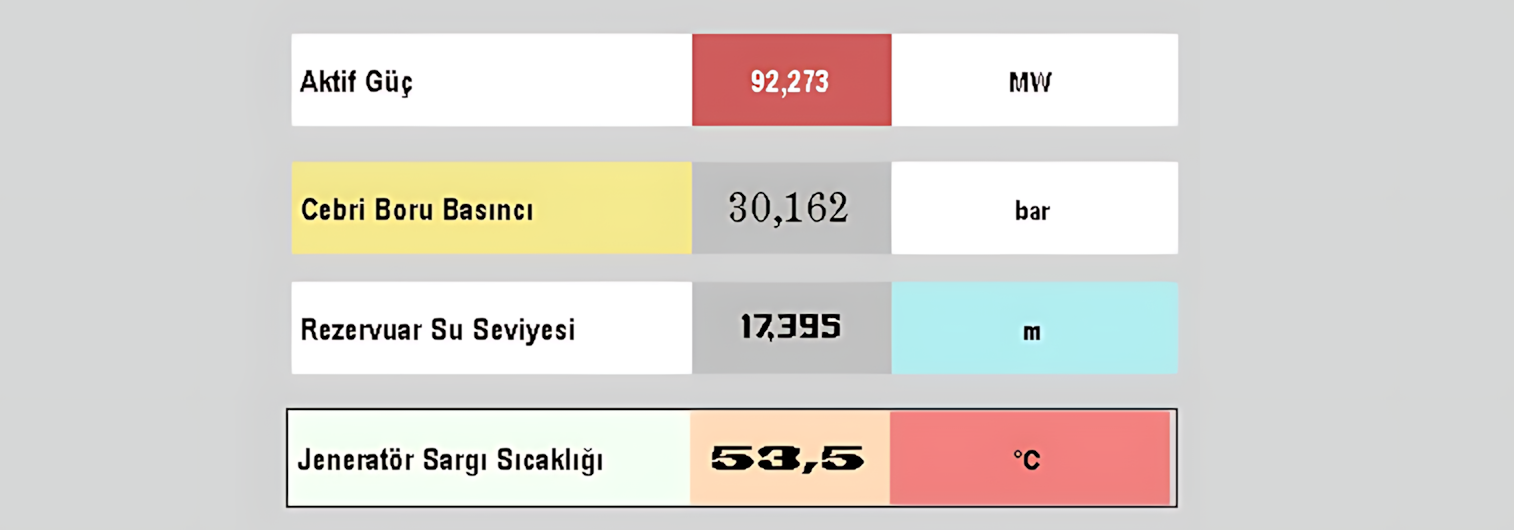
The most important feature of this control is that the VALUE field can be linked to SCADA data. Once the connection is established, the value displayed by the control updates as the data changes. This arrangement allows the operator to answer the questions “which value, how much, and in what unit?” in one place, without having to interpret the process value separately.
In this example, ACTIVE POWER is the title, 125.4 is the live data value, and MW is the unit.
The LABEL control is based on configuring three main display areas together. The visibility, text, width, color, font, and text alignment of each area can be adjusted independently.
Identifies what the displayed SCADA data represents, such as Active Power, Pressure, Temperature, or Reservoir Level.
The main area in which the live process value received from the SCADA system is displayed. The value text, color, font, width, and alignment can be configured separately.
Identifies the engineering unit of the displayed value. Units such as MW, bar, °C, m³/s, kV, and A can be shown in this area.
The basic operating and appearance settings of the LABEL control are listed in the table below. These properties define the control type, update interval, decimal-place display, and general appearance.
| Property | EOS English Equivalent | Default | Description |
|---|---|---|---|
UCType |
Control Type | ETIKET |
Defines the type of the LABEL user control. |
UpdateInterval |
Update Interval | 1000 ms |
Defines the data update interval of the control. |
DecimalPoint |
Decimal Places | 0 |
Defines the number of decimal places used to display the numerical value. |
UCBackColor |
Control Background Color | Transparent |
Defines the general background color of the control. |
UCForeColor |
Control Foreground Color | Black |
Defines the general text/foreground color of the control. |
UCFont |
Control Font | Arial Narrow, 12 pt |
Defines the control's base font. |
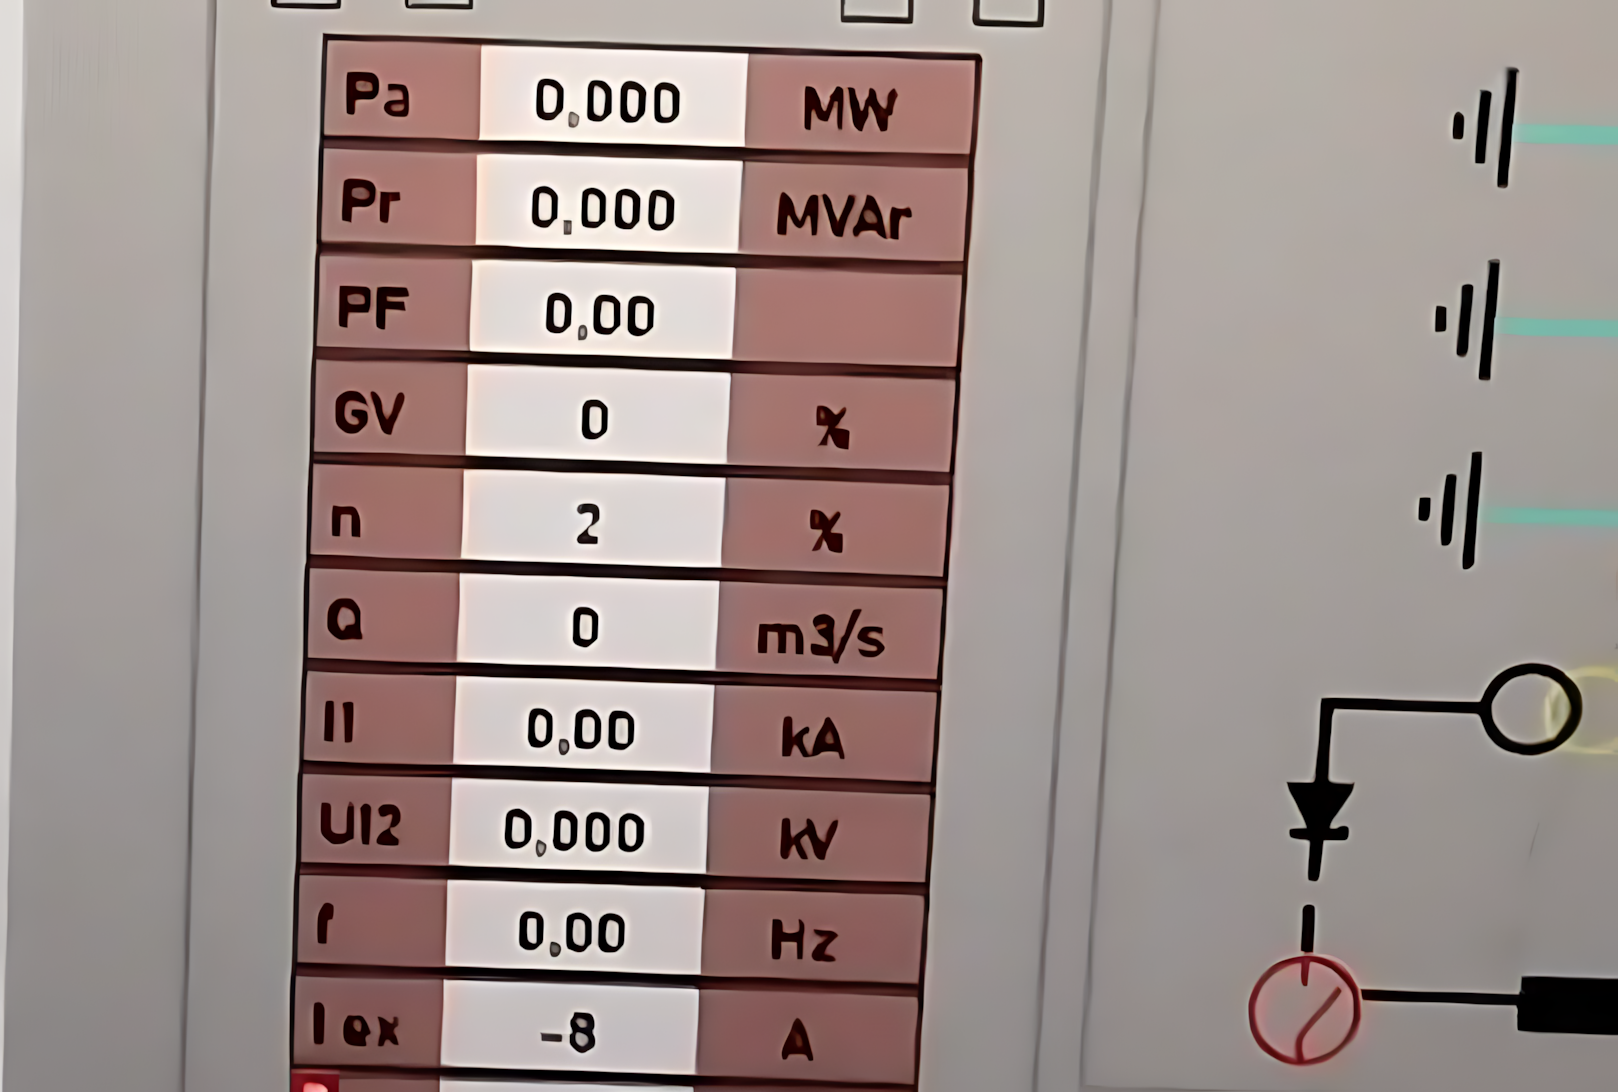
The header, value, and unit areas each have separate visibility and layout options. This allows the same user control to be configured in different ways, from a small status label to a detailed process information block.
| Property | EOS English Equivalent | Default | Description |
|---|---|---|---|
DisplayHeader |
Display Header | true |
Determines whether the header text is displayed. |
DisplayValue |
Display Value | true |
Determines whether the live data value is displayed. |
DisplayUnitText |
Display Unit Text | true |
Determines whether the unit text is displayed. |
HeaderMargin |
Header Margin | 0 |
Defines the margin applied to the header area. |
ValueMargin |
Value Margin | 0 |
Defines the margin applied to the value area. |
The VALUE field is the central live information area of the LABEL control. A process variable monitored on a SCADA screen can be linked to this field so that its current value is continuously displayed to the operator.
| Property | EOS English Equivalent | Default | Description |
|---|---|---|---|
ValueBackColor |
Value Background Color | White |
Defines the background color of the value area. |
ValueForeColor |
Value Text Color | Black |
Defines the color of the value text. |
ValueFont |
Value Font | Arial Narrow, 12 pt, Bold |
Defines the font and style of the value text. |
ValueText |
Value Text | "" |
Defines the text used in the value area; when live data is connected, this field is associated with the data display. |
ValueWidth |
Value Width | 100 |
Defines the width of the value area. |
ValueTextAlignment |
Value Text Alignment | Middleleft |
Defines the position of the value text within its area. |
Live Data Display: In typical LABEL usage, a process variable from SCADA is linked to the VALUE field. For example, the active power, voltage, or current of a generator can be monitored on the screen as a continuously updated value.
The HEADER field explains the meaning of the displayed live data to the user. Establishing a direct visual relationship between the header and the value improves the speed of information retrieval, especially on SCADA pages where many process values are monitored on the same screen.
| Property | EOS English Equivalent | Default | Description |
|---|---|---|---|
HeaderBackColor |
Header Background Color | White |
Defines the background color of the header area. |
HeaderForeColor |
Header Text Color | Black |
Defines the color of the header text. |
HeaderFont |
Header Font | Arial Narrow, 10 pt, Bold |
Defines the font and style of the header text. |
HeaderText |
Header Text | HEADER |
Defines the text displayed in the header area. |
HeaderWidth |
Header Width | 120 |
Defines the width of the header area. |
HeaderTextAlignment |
Header Text Alignment | Middleleft |
Defines the position of the header text within its area. |
The UNIT field indicates the engineering unit in which the live value is expressed. Presenting the unit alongside the value allows the operator to understand the physical meaning of the numerical value directly.
| Property | EOS English Equivalent | Default | Description |
|---|---|---|---|
UnitBackColor |
Unit Background Color | White |
Defines the background color of the unit area. |
UnitForeColor |
Unit Text Color | Black |
Defines the color of the unit text. |
UnitFont |
Unit Font | Arial Narrow, 9.75 pt, Bold |
Defines the font and style of the unit text. |
UnitText |
Unit Text | UNIT |
Defines the text displayed in the unit area. |
UnitWidth |
Unit Width | 100 |
Defines the width of the unit area. |
UnitTextAlignment |
Unit Text Alignment | Middleleft |
Defines the position of the unit text within its area. |
Text alignment for the HEADER, VALUE, and UNIT areas is configured using the GNKonum enumeration. The same alignment options are available for all three areas, allowing different layout designs to be created.
| Enumeration | English |
|---|---|
Topleft |
Top Left |
Topcenter |
Top Center |
Topright |
Top Right |
Middleleft |
Middle Left |
Middlecenter |
Middle Center |
Middleright |
Middle Right |
Bottomleft |
Bottom Left |
Bottomcenter |
Bottom Center |
Bottomright |
Bottom Right |
The LABEL control supports border display to visually distinguish the information block from other screen objects. Border visibility, thickness, and color can be configured through separate properties.
| Property | EOS English Equivalent | Default | Description |
|---|---|---|---|
DisplayBorder |
Display Border | false |
Determines whether the control border is displayed. |
BorderWidth |
Border Width | 1 |
Defines the border width. |
BorderColor |
Border Color | Black |
Defines the border color. |
LABEL_STATE_COLLECTION contains state definitions that allow the LABEL control to change its appearance for different data values or value ranges. This enables the same information block to convey different visual meanings depending on the current process value.
Each state definition includes properties such as background color, text color, threshold value, and blinking behavior.
| Property | EOS English Equivalent | Default | Description |
|---|---|---|---|
LevelBackColor |
Level Background Color | White |
Defines the background color for the relevant data state. |
LevelForeColor |
Level Text Color | Black |
Defines the text color for the relevant data state. |
LevelThreshold |
Level Threshold | 10 |
Defines the threshold value used in the state definition. |
BlinkActive |
Blinking Enabled | false |
Determines whether blinking is enabled for the relevant data state. |
The LABEL control can do more than display the current value of a live signal. The Fast Graph feature can also be used to examine how that value has changed over the recent past.
When UseFastGraph = true, a mini button appears at the bottom of the control to open the Fast Graph function. When the user clicks this button, a graph opens showing changes in the relevant data over the selected time interval.
The graph can be used to examine the recent history of the live value. The graph automatically disappears when the mouse is scrolled.
| Property | EOS English Equivalent | Default | Description |
|---|---|---|---|
UseFastGraph |
Use Fast Graph | false |
Determines whether the Fast Graph mini button and its associated graph function are enabled. |
FastGraphTimeInterval |
Fast Graph Time Interval | Last30minutes |
Defines the time interval to be examined in the Fast Graph. |
The FastGraphTimeInterval property defines the historical data range displayed in the Fast Graph. The available options cover different analysis periods, from short-term changes to daily trends.
| Enumeration | English | Graph Coverage |
|---|---|---|
Last10minutes |
Last 10 Minutes | Data changes over the last 10 minutes. |
Last30minutes |
Last 30 Minutes | Data changes over the last 30 minutes. |
Last1hour |
Last 1 Hour | Data changes over the last hour. |
Last3hours |
Last 3 Hours | Data changes over the last 3 hours. |
Last6hours |
Last 6 Hours | Data changes over the last 6 hours. |
Last12hours |
Last 12 Hours | Data changes over the last 12 hours. |
Last1day |
Last 1 Day | Data changes over the last day. |
Thanks to its compact structure, LABEL is suitable for displaying numerous process values within an organized information layout on SCADA screens. On screens where operators need to identify a value quickly, displaying the header, live value, and unit in the same block provides a significant visual advantage.
Monitoring the active power values of generating units in MW, together with their headers and unit information.
Displaying electrical measurements together with engineering units such as kV, V, A, or kA.
Presenting analog values such as process temperature, oil pressure, and steam pressure in a compact format.
Displaying reservoir, tank, or channel levels and flow rates within the same screen layout.
Presenting percentage-based, ratio-based, or dimensionless process indicators with descriptive headers.
Arranging numerous measurements for units, transformers, pumps, turbines, or auxiliary systems using a consistent design language.
The strength of the LABEL control lies not only in displaying an individual value, but also in arranging multiple information blocks within a consistent design language. Aligning headers, highlighting live values with a more prominent font, and presenting units consistently help operators scan the screen more quickly.
TURBINE SPEED → 300.0 → rpm
ACTIVE POWER → 125.4 → MW
GENERATOR VOLTAGE → 10.5 → kV
POWER FACTOR → 0.98 → pu
LABEL is a fundamental yet highly flexible user control that presents live process data on EOS SCADA screens in a clear, well-organized information block. Its HEADER + VALUE + UNIT structure enables operators to understand what is being measured, its current value, and its engineering unit at a glance.
The ability to format the header, value, and unit areas independently; define appearance changes based on data values through LABEL_STATE_COLLECTION; and examine historical value changes using Fast Graph makes LABEL a comprehensive information display control that can be adapted to different SCADA screen layouts.

Free Software Download Center
Software for industrial data collection, monitoring, and analysis.

Technical Support
Software documentation, sample code, and practical technical information.
You can contact us regarding EOS software, technical documentation, or industrial data communication.