Vertical
The Vertical option configures the value scale as a compact indicator that can be read from bottom to top or from top to bottom. The example provided by the user uses this orientation.
EOS SCADA • GTRACKBAR • LINEAR INDICATOR • PROCESS VALUE
LINEAR INDICATOR (GTRACKBAR) is a user control used to visually monitor a process value on a linear scale between defined lower and upper limits. With features such as vertical or horizontal orientation, scale markings, numeric labels, a value box, and a moving indicator head, it presents numerical values on SCADA screens in a compact and easy-to-read format.
The basic principle of the control is to display a numerical value not merely as a number, but also through its position on the scale. This allows operators to assess at a glance how close the value is to the lower limit, the middle range, or the upper limit.

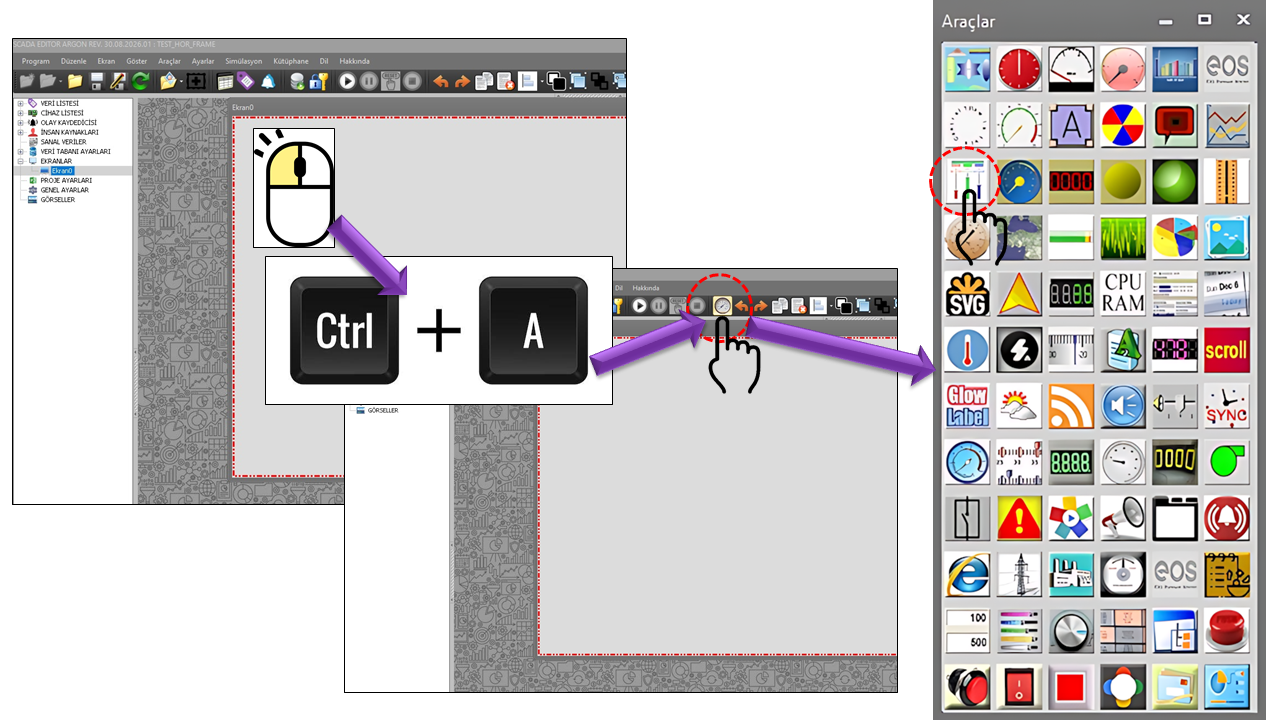
LINEAR INDICATOR (GTRACKBAR) is a user control used on EOS SCADA screens to visually represent a numerical value on a linear scale. The control can operate horizontally or vertically and shows the current value's position on the scale between the minimum and maximum limits of the value range.
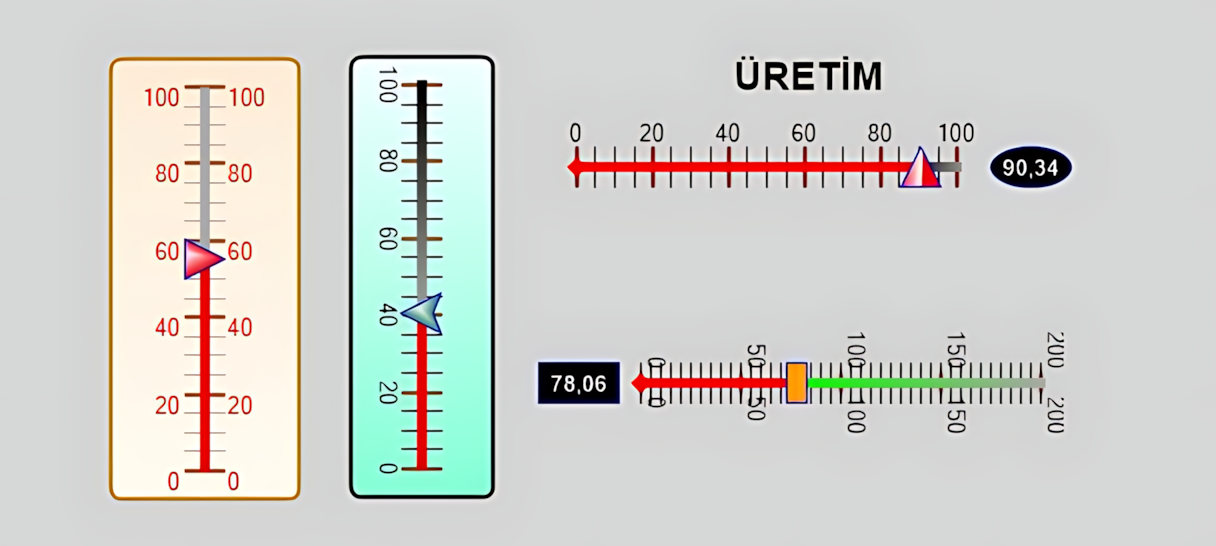
The LINEAR INDICATOR helps operators quickly perceive the level of a process value within a specific operating range. Its appearance can be configured according to process requirements using major and minor ticks, numerical labels, the indicator head, a value box, colors, and visual formatting options.
The example shows a 0–150 range on a vertical scale, minor and major ticks, numerical tick labels on both sides, and a red indicator head near the bottom.
This is a typical example of how GTRACKBAR can represent a value through its position on a linear scale, rather than through the amount of a bar that is filled.
Minimum value → scale → current value → maximum value. As the value changes, the slider/indicator head moves to the corresponding position on the scale. In the EOS source code, the minimum and maximum values and the indicator head's shape, size, and colors can be configured separately.
The Orientation property determines the control's orientation on the screen.
The Vertical option configures the value scale as a compact indicator that can be read from bottom to top or from top to bottom. The example provided by the user uses this orientation.
The Horizontal option allows the control to be used as a horizontal linear indicator. It may be suitable for wide screens or layouts that follow horizontal process flows around equipment.
Orientation makes it easier to position the indicator according to the available space on the SCADA screen and the natural visual direction of the relevant process information.
MinValue and MaxValue define the two limits of the linear indicator's measurement range. The default range in the provided source is 0–100.
The ValueMultiplier value is defined as 1 in the source. This property allows the displayed value to be scaled using a multiplier. ValueStrFormat specifies the numeric format used in the value box.
The minimum and maximum values should match the process's actual operating range. An excessively wide range can visually compress small changes, while an excessively narrow range may cause normal operating values to extend beyond the scale. The scale should therefore be selected by considering process engineering requirements and screen design together.
One of GTRACKBAR's distinguishing features is the ability to enhance the linear scale with minor ticks, major ticks, and numerical labels.
| Property | EOS English Equivalent | Default | Description |
|---|---|---|---|
MinorTickColor |
Minor Tick Color | DarkGray |
Specifies the color of the minor scale marks. |
MinorTickType |
Minor Tick Type | Middle |
Specifies the position of minor ticks relative to the scale. |
MinorTickInterval |
Minor Tick Interval | 5 |
Specifies the value interval between minor ticks. |
MinorTickOffset |
Minor Tick Offset | 0 |
Specifies the positional offset of minor ticks. |
MinorTickWidth |
Minor Tick Width | 20 |
Specifies the width of the minor tick lines. |
MinorTickThickness |
Minor Tick Thickness | 1 |
Specifies the thickness of the minor tick lines. |
MajorTickColor |
Major Tick Color | SaddleBrown |
Specifies the color of the major scale marks. |
MajorTickType |
Major Tick Type | Middle |
Specifies the position of major ticks. |
MajorTickInterval |
Major Tick Interval | 20 |
Specifies the value interval between major ticks. |
MajorTickOffset |
Major Tick Offset | 10 |
Specifies the starting positional offset of major ticks. |
MajorTickWidth |
Major Tick Width | 20 |
Specifies the width of the major tick lines. |
MajorTickThickness |
Major Tick Thickness | 2 |
Specifies the thickness of the major tick lines. |
The appearance of numerical values on the scale is controlled by the TickLabel... properties.
| Property | EOS English Equivalent | Default |
|---|---|---|
TickLabelFontColor |
Tick Label Font Color | Red |
TickLabelFont |
Tick Label Font | Arial Narrow, 8.25 pt |
TickLabelType |
Tick Label Type | Both |
TickLabelXOffset |
Tick Label X Offset | 0 |
TickLabelYOffset |
Tick Label Y Offset | 0 |
TickLabelRotate |
Rotate Tick Labels | false |
TickLabelStrFormat |
Tick Label Format | "" |
In the provided example, the numerical labels appear on both sides of the scale, clearly illustrating the visual effect of setting TickLabelType=Both.
The moving part that indicates the value's position on GTRACKBAR is configured through the slider/indicator head properties.
| Property | EOS English Equivalent | Default | Description |
|---|---|---|---|
SliderHeadShape |
Slider Head Shape | UpTriangle |
Specifies the geometric shape of the value indicator. |
SliderHeadSize |
Slider Head Size | 20 × 20 |
Specifies the size of the indicator head. |
SliderHeadColor1 |
Slider Head Color 1 | Red |
Specifies the first color of the indicator head. |
SliderHeadColor2 |
Slider Head Color 2 | AliceBlue |
Specifies the second color of the indicator head. |
SliderBorderColor |
Slider Border Color | Blue |
Specifies the border color of the indicator head. |
SliderHeadOffset |
Slider Head Offset | 0 |
Specifies the positional offset of the indicator head. |
SliderCapEnd |
Slider End Cap | Flat |
Specifies the end geometry of the slider. |
SliderCapStart |
Slider Start Cap | Flat |
Specifies the starting geometry of the slider. |
The GTRACKBAR source code explicitly defines the shape and visual properties of the slider head. However, the supplied source excerpt does not show a separate event, method, or input property indicating that an operator can drag the control to write a value to a tag. Therefore, this page treats the indicator head strictly as a visual value indicator. In general HMI slider controls, changing a process value by dragging the slider is common; this does not establish that EOS GTRACKBAR definitely supports the same behavior.
The control consists of more than scale lines. Properties such as background, border, gradient, glass effect, and opacity allow the indicator to be adapted to the overall design of a SCADA screen.
| Property | EOS English Equivalent | Default |
|---|---|---|
BrushStyle |
Brush Style | Path |
BrushDirection |
Brush Direction | ForwardDiagonal |
BackgroundTheme |
Background Theme | Gradient |
BackColor1 |
Background Color 1 | AntiqueWhite |
BackColor2 |
Background Color 2 | FloralWhite |
BorderColor |
Border Color | DarkGoldenrod |
CurveMode |
Curve Mode | All |
BorderStyle |
Border Style | Fixedsingle |
BorderWidth |
Border Width | 2 |
Curvature |
Curvature | 5 |
GlassColor |
Glass Color | Orange |
Opacity |
Opacity | 50 |
The displayed numerical value can optionally be presented in a separate box. This is particularly useful on small screens or on SCADA screens where the value on the scale needs to be read quickly.
| Property | EOS English Equivalent | Default |
|---|---|---|
ValueBoxAlignment |
Value Box Alignment | None |
ValueBoxSize |
Value Box Size | 40 × 20 |
ValueBoxBackColor |
Value Box Background Color | Black |
ValueBoxFontColor |
Value Box Font Color | AliceBlue |
ValueBoxBorderColor |
Value Box Border Color | MediumBlue |
ValueBoxFont |
Value Box Font | Arial Narrow, 8.25 pt |
ValueBoxShape |
Value Box Shape | Rectangle |
ValueStrFormat |
Value String Format | F2 |
The DisplayLabel property controls whether an additional description or label is displayed on the control.
| Property | EOS English Equivalent | Default |
|---|---|---|
DisplayLabel |
Display Label | false |
LabelAlighnment |
Label Alignment | Center |
LabelText |
Label Text | "" |
LabelColor |
Label Color | MediumBlue |
LabelFont |
Label Font | Arial Narrow, 12 pt, Bold |
LabelPadding |
Label Padding | 0,0,0,0 |
The basic user control properties of GTRACKBAR are listed below:
| Property | EOS English Equivalent | Default | Description |
|---|---|---|---|
UCType |
Control Type | GTRACKBAR |
Defines the type of the user control. |
UpdateInterval |
Update Interval | 1000 ms |
Specifies the control's update interval. |
DecimalPoint |
Decimal Places | 0 |
Specifies the number of decimal places used to display numerical values. |
UCBackColor |
Control Background Color | Transparent |
Specifies the control's default background color. |
UCForeColor |
Control Foreground Color | Black |
Specifies the control's default text color. |
UCFont |
Control Font | Arial Narrow, 8.25 pt |
Specifies the control's default font. |
Orientation |
Orientation | Vertical |
Specifies whether the control is oriented horizontally or vertically. |
ValueMultiplier |
Value Multiplier | 1 |
Scales the displayed value using a multiplier. |
MaxValue |
Maximum Value | 100 |
Specifies the upper limit of the scale. |
MinValue |
Minimum Value | 0 |
Specifies the lower limit of the scale. |
Various visual behaviors in the GTRACKBAR source code are defined through enumerations.
| Enumeration | Options |
|---|---|
GNOrientasyon |
Horizontal, Vertical |
GTGradyanTuru |
Linear, Linear, Path |
SHGradyanTuru |
None, Horizontal, Vertical, Forward Diagonal, Backward Diagonal |
GTTema |
None, Glass, Gradient |
GNCerceveTuru |
None, Fixed Single, Fixed 3D |
GNYatayMetinHizalama |
Left, None, Right |
GTSekil |
Ellipse, Rectangle |
GTIgne |
Ellipse, Rectangle, Up Triangle, Down Triangle, Up Arrow, Down Arrow |
RMSekilTuru |
Flat, Square, Round, Triangle, No Anchor, Square Anchor, Round Anchor, Diamond Anchor, Arrow Anchor, Anchor Mask, Custom |
GTTikKonum |
None, Top Right, Bottom Left, Both Sides, Middle |
GTHizalama |
Near, Center, Far |
In industrial HMI/SCADA software, linear indicators and slider-like controls are used to monitor process values within a defined range, view their positions on a scale, and, in some products, allow operators to adjust values. Siemens WinCC Unified documentation explains that its Slider object can monitor and adjust process values within a defined range, and describes configurations such as minimum/maximum scale limits, a current-value indicator, and color-coded thresholds or ranges. citeturn0search0turn0search3
Quickly displaying the position of pressure, temperature, level, flow rate, speed, or similar continuously varying values within a defined range.
Visually displays the position of a numerical process value on a linear scale between the specified minimum and maximum limits. As the value changes, the indicator head moves accordingly along the scale.
Provides a suitable visual format for showing the position of values such as tank level, reservoir level, flow rate, and fluid flow on a scale.
Compactly displaying the level of numerical values such as voltage, current, power, or power factor within a defined range.
Visually representing the operating range and current position of continuously varying parameters such as motor speed and valve position.
Supporting the recognition of normal operating regions through major scale ticks and visual color differences.
Free Software Download Center
Software for industrial data collection, monitoring, and analysis.
Technical Support
Software documentation, sample code, and practical technical information.
You can contact us regarding EOS software, technical documentation, or industrial data communication.