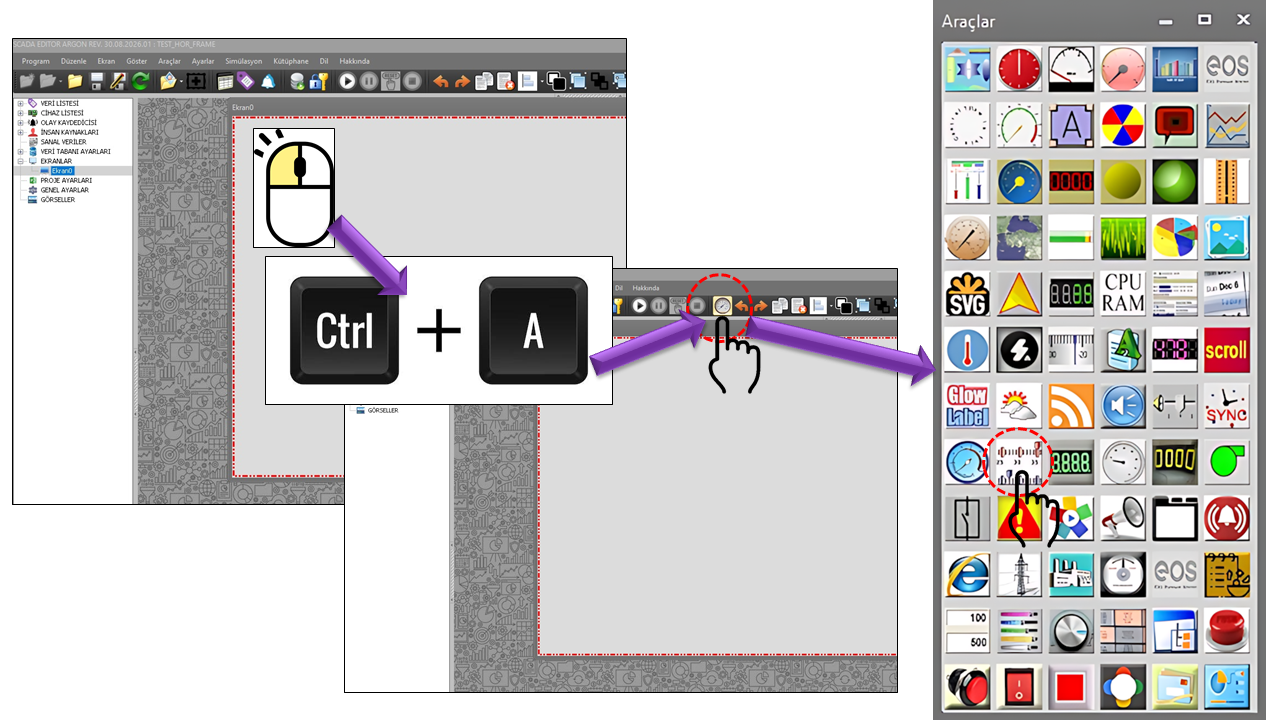
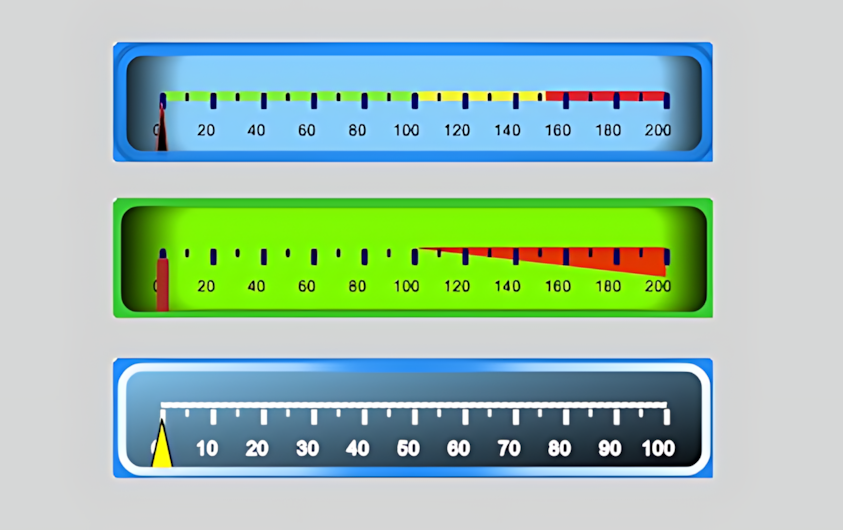
About the HORIZONTAL FRAME ENGINE
The HORIZONTAL FRAME ENGINE is a component-based gauge engine
used for horizontal gauge designs in EOS SCADA. Its source structure shows that multiple
collections are combined rather than relying on a single drawing element. This approach
allows a wide variety of horizontal gauge layouts to be created using the same underlying engine.
The engine's main strength is that it allows a gauge to be much more than a simple bar or
single pointer. Different visual layers can be defined together within a gauge, including a
numeric frame, LED segments, labels,
color ranges, pointers, a scale bar,
and a horizontal frame.
Therefore, it is more accurate to regard HORIZONTAL_FRAME not as a ready-made gauge, but as
a base engine for creating gauges. Designers can select the components they
need and configure their positions, dimensions, colors, gradients, shadows, and data connections.
Basic concept:
Data → Scale → Ranges → Pointers → Numeric/LED display → Labels →
Horizontal frame. These layers form the different visual components of the same gauge design.
Important Design Warning:
The size of the HORIZONTAL_FRAME control cannot be resized with the mouse
during SCADA screen design. Before placing the control on the screen, the user must
determine its exact dimensions and design the layout accordingly.
Width and height should be selected carefully from the outset, especially for gauges
that will be added to a template library.
Component-Based Gauge Architecture
In the source code, the HORIZONTAL FRAME ENGINE is defined to work directly with seven
separate collections. Each collection represents a different visual layer. This architecture
can transform a simple horizontal indicator into a multi-component engineering gauge.
NUMFRAMENumeric Frame
LED_COLLECTIONDigital Segments
LABEL_COLLECTIONLabels
RANGE_COLLECTIONColor Ranges
POINTER_COLLECTIONPointers
SCALEBAR_COLLECTIONScale Bar
HORFRAME_COLLECTIONHorizontal Frame
HORIZONTAL_FRAMEParent Engine
Numeric Frame
BASEUI_NUMFRAME_COLLECTION is the layer used to display a data name
inside a numeric frame at a specified position and size. It includes properties
such as outline, center and end colors, gradient, rounded corners, and an associated frame.
Digital Segments
BASEUI_LED_COLLECTION creates an LED/digital segment display.
The digital display layer can be configured using visual properties such as
segment count, primary color, glow, gradient, border, and shadow.
Labels
BASEUI_LABEL_COLLECTION creates text-based annotations on the gauge.
It supports properties such as position, text, font, color, angle, border,
gradient, shadow, and background image.
Color Ranges
BASEUI_RANGE_COLLECTION is used to visually highlight a specific
value range. Its properties include start/end values, width, color, opacity,
border, and connection to a scale bar.
Pointers
BASEUI_POINTER_COLLECTION creates pointers that indicate values
on the gauge. Multiple pointers can be used in the same design to compare
different data points against the same scale.
Scale Bar
BASEUI_SCALEBAR_COLLECTION creates the measurement scale using
major/minor ticks, value labels, start/end values, angle, and custom labels.
The top-level control properties of the HORIZONTAL FRAME ENGINE are defined by the
source code values shown below. Collection properties are described individually in
the following sections.
| Property |
EOS English Equivalent |
Default Value |
Description |
UCType |
Control Type |
HORIZONTAL_FRAME |
Defines the type of user control in EOS SCADA. |
UpdateInterval |
Update Interval |
1000 ms |
Defines the control's update interval. |
DecimalPoint |
Decimal Places |
0 |
Defines the number of decimal places used to display numeric values. |
UCBackColor |
Control Background Color |
Transparent |
Defines the control's primary background color. |
UCForeColor |
Control Text Color |
Black |
Defines the control's primary foreground/text color. |
UCFont |
Control Font |
Arial Narrow, 8.25 pt |
Defines the control's primary font. |
NumericFrameCollection |
Numeric Frame Collection |
— |
Allows one or more numeric frame components to be defined. |
DigitalSegments |
Digital Segments |
— |
Defines the LED/digital segment components. |
Labels |
Labels |
— |
Defines the text labels displayed on the gauge. |
Ranges |
Ranges |
— |
Allows measurement ranges to be visually marked. |
Pointers |
Pointers |
— |
Defines the pointers that display data values on the scale. |
Scalebars |
Scale Bars |
— |
Creates the measurement axis using major/minor ticks and scale labels. |
HorizontalFrames |
Horizontal Frames |
— |
Defines the main horizontal frame layers of the gauge. |
Horizontal Frame Collection
BASEUI_HORFRAME_COLLECTION defines the main horizontal body of the gauge.
The source code specifies a default size of 300 × 60 and a frame
width of 7. The visual body can be designed using the shape type,
outline, center/end colors, and gradient.
| Property |
EOS English Equivalent |
Default Value |
Description |
FrameLocation |
Frame Position |
(0, 0) |
Defines the position of the horizontal frame within the control. |
FrameSize |
Frame Size |
300 × 60 |
Defines the size of the horizontal frame. |
FrameWidth |
Frame Width |
7 |
Defines the thickness of the frame/body. |
HFMainColor |
Main Color |
Black |
Defines the main color of the horizontal frame. |
CenterColor |
Center Color |
Black |
Defines the center color used in a gradient or center color transition. |
HFEndColor |
End Color |
LightSkyBlue |
Defines the end color of the horizontal frame. |
FillGradientType |
Fill Gradient Type |
Center |
Defines the gradient style used for the frame fill. |
Outline |
Outline Type |
Type4 |
Defines the outer outline style of the horizontal frame. |
ShapeType |
Shape Type |
Roundedrectangle |
Defines the basic geometric shape of the horizontal frame. |
FrameImage |
Frame Image |
"" |
Defines the use of an image file in the frame. |
BackImage |
Background Image |
"" |
Defines an image that can be used as the frame's background. |
One of the strongest features of HORIZONTAL_FRAME is the ability to define multiple
pointers on a single gauge. Each pointer can have its own data source,
width, length, color, geometry, and scale connection. This makes it possible to display
different information, such as the actual value, target value, and alarm threshold,
within the same visual structure.
| Property |
EOS English Equivalent |
Default Value |
Description |
PointerDataName |
Pointer Data Name |
"" |
Defines the data name associated with the pointer. |
PointerWidth |
Pointer Width |
2 |
Defines the width of the pointer. |
PointerLength |
Pointer Length |
55 |
Defines the length of the pointer within the gauge. |
FillColor |
Fill Color |
Black |
Defines the pointer's main fill color. |
EndColor |
End Color |
White |
Defines the end color of the pointer gradient. |
BorderColor |
Border Color |
Black |
Defines the pointer border color. |
EnableBorder |
Enable Border |
true |
Specifies whether the pointer border is enabled. |
EnableGradient |
Enable Gradient |
false |
Specifies whether a gradient is used on the pointer. |
BorderWidth |
Border Width |
1 |
Defines the pointer border thickness. |
PointerShapeType |
Pointer Shape Type |
Type2 |
Defines the geometric shape of the pointer. |
OffsetFromCenter |
Offset from Center |
0 |
Adjusts the pointer's relative position from the center. |
PointerImage |
Pointer Image File |
"" |
Defines the use of an image file for the pointer. |
PointerPosition |
Pointer Position |
Inner |
Defines the pointer's position relative to the scale. |
CapPointerVisible |
Pointer Cap Visible |
true |
Specifies whether the pointer's center cap is displayed. |
CapType |
Cap Type |
Type1 |
Defines the geometry of the center cap. |
CapOnTop |
Cap on Top |
true |
Defines the center cap's position in the drawing order. |
CapPointerFillColor |
Pointer Cap Fill Color |
Black |
Defines the fill color of the center cap. |
CapPointerBorderWidth |
Pointer Cap Border Width |
1 |
Defines the border width of the center cap. |
CapPointerEnableBorder |
Enable Pointer Cap Border |
true |
Specifies whether the center cap border is enabled. |
CapPointerDiameter |
Pointer Cap Diameter |
15 |
Defines the diameter of the center cap. |
CapPointerShadowOffset |
Pointer Cap Shadow Offset |
0 |
Defines the shadow offset of the center cap. |
Scale Bar and Measurement Axes
BASEUI_SCALEBAR_COLLECTION turns the horizontal gauge into a readable
measurement axis. The scale can be configured in detail using numerous properties,
including major ticks, minor ticks, value labels, start and end values, custom labels,
and angle.
| Property |
EOS English Equivalent |
Default Value |
Description |
OffsetFromFrame |
Offset from Frame |
0 |
Defines the position of the scale bar relative to the frame. |
ScaleBarSize |
Scale Bar Size |
2 |
Defines the size of the scale bar. |
BorderStyle |
Border Style |
Notset |
Defines the border style of the scale bar. |
MajorTickNumber |
Number of Major Ticks |
11 |
Defines the number of major ticks. |
TickMajorSize |
Major Tick Size |
3 × 8 |
Defines the size of the major ticks. |
TickMajorType |
Major Tick Type |
Roundedrect |
Defines the geometric type of the major ticks. |
TickMajorTickPosition |
Major Tick Position |
Inner |
Defines the position of the major ticks relative to the scale. |
MinorTickNumber |
Number of Minor Ticks |
2 |
Defines the number of minor ticks between major ticks. |
TickMinorSize |
Minor Tick Size |
2 × 4 |
Defines the size of the minor ticks. |
TickMinorType |
Minor Tick Type |
Roundedrect |
Defines the geometric type of the minor ticks. |
TickMinorTickPosition |
Minor Tick Position |
Inner |
Defines the position of the minor ticks relative to the scale. |
TickLabelLabelPosition |
Tick Label Position |
Inner |
Defines the position of the scale value labels. |
TickLabelLabelDirection |
Tick Label Direction |
Normal |
Defines the orientation of the tick labels. |
TickLabelFontColor |
Tick Label Font Color |
Black |
Defines the text color of the scale labels. |
TickLabelXOffsetFromScale |
Tick Label X Offset |
15 |
Defines the horizontal offset of the tick labels relative to the scale. |
TickLabelYOffsetFromScale |
Tick Label Y Offset |
0 |
Defines the vertical offset of the tick labels relative to the scale. |
TickLabelAngle |
Tick Label Angle |
0 |
Defines the rotation angle of the tick text. |
StartValue |
Start Value |
0 |
Defines the starting value of the scale. |
EndValue |
End Value |
200 |
Defines the ending value of the scale. |
SweepAngle |
Sweep Angle |
80 |
Defines the scale sweep angle specified in the source code. |
StartAngle |
Start Angle |
45 |
Defines the starting angle of the scale. |
CustomLabel |
Custom Label |
"" |
Allows custom text to be displayed on the scale. |
CastLabelToInteger |
Cast Label to Integer |
false |
Specifies whether scale labels are treated as integers. |
Color Ranges and Operating Zones
BASEUI_RANGE_COLLECTION can be used to visually distinguish specific value
zones on the gauge. The source code defines properties such as start and end values,
start/end widths, fill color, gradient, opacity, border, and connection to a scale bar.
| Property |
EOS English Equivalent |
Default Value |
Description |
RangeDataName |
Range Data Name |
"" |
Defines the data connection for the range component. |
RangePosition |
Range Position |
Inner |
Defines the position of the range relative to the scale/body. |
StartValue |
Start Value |
0 |
Defines the starting value of the colored region. |
EndValue |
End Value |
50 |
Defines the ending value of the colored region. |
StartWidth |
Start Width |
5 |
Defines the width at the starting end of the range. |
EndWidth |
End Width |
1 |
Defines the width at the ending end of the range. |
EnableGradient |
Enable Gradient |
false |
Specifies whether a gradient is used on the range. |
FillColor |
Fill Color |
Red |
Defines the fill color of the range. |
EndColor |
End Color |
White |
Defines the end color of the range gradient. |
EnableBorder |
Enable Border |
false |
Specifies whether the range border is enabled. |
OffsetFromScale |
Offset from Scale |
0 |
Defines the position of the range relative to the scale. |
Opaque |
Opacity |
255 |
Defines the transparency/opacity value of the range. |
ConnectedScaleBarID |
Connected Scale Bar ID |
"" |
Defines which scale bar the range is connected to. |
ConnectedFrameID |
Connected Frame ID |
"" |
Defines which frame the range is associated with. |
Numeric Frame, LED, and Label Layers
| Collection |
Property |
EOS English Equivalent |
Default Value |
Function |
| NUMFRAME |
NumframeDataName |
Numeric Frame Data Name |
"" |
Defines the data name for the numeric frame. |
FrameLocation |
Frame Position |
(0, 0) |
Defines the position of the numeric frame. |
FrameSize |
Frame Size |
200 × 50 |
Defines the size of the numeric frame. |
Outline |
Outline Type |
None |
Defines the outline type of the numeric frame. |
NFMainColor |
Main Color |
Black |
Defines the main color of the numeric frame. |
CenterColor |
Center Color |
SlateBlue |
Defines the center color of the frame gradient. |
NFEndColor |
End Color |
DarkBlue |
Defines the end color of the frame gradient. |
FillGradientType |
Fill Gradient Type |
Verticalcenter |
Defines the fill transition of the numeric frame. |
| LED |
NumberOfSegments |
Number of Segments |
Fourteen |
Defines the number of segments in the digital display. |
LedBackColor |
LED Background Color |
Black |
Defines the background color of the LED segments. |
BackOpacity |
Background Opacity |
0 |
Defines the opacity of the LED background. |
FontThickness |
Font Thickness |
4 |
Defines the stroke thickness of the digital display. |
LCMainColor |
Main Color |
LimeGreen |
Defines the main LED color. |
EnableGlare |
Enable Glow |
true |
Enables the LED glow effect. |
EnableGradient |
Enable Gradient |
false |
Specifies whether an LED gradient is used. |
DisplayShadow |
Display Shadow |
false |
Specifies whether the LED shadow is displayed. |
| LABEL |
LabelLocation |
Label Position |
(0, 0) |
Defines the position of the label within the gauge. |
LabelText |
Label Text |
"" |
Defines the text to be displayed in the label. |
LabelColor |
Label Color |
Black |
Defines the color of the label text. |
LabelFont |
Label Font |
Arial, 10 pt |
Defines the label font. |
LabelAngle |
Label Angle |
0 |
Defines the rotation angle of the label. |
DisplayBorder |
Display Border |
false |
Specifies whether a border is displayed around the label. |
UseGradient |
Use Gradient |
false |
Specifies whether a gradient is used in the label background. |
BackgroundImage |
Background Image |
"" |
Specifies the use of a background image in the label layer. |
Horizontal gauges provide quick visual recognition by positioning a process value along
a scale. In industrial HMI/SCADA products, linear gauges are used to display process
values as bars or scales. Rockwell's HMI documentation describes a Linear Gauge as a way
to monitor a numeric value using an indicator that moves along a bar scale. Siemens HMI/SCADA
solutions likewise emphasize graphical visualization of process values and improving
operator situational awareness.
Electrical Power
Displaying active power, reactive power, current, voltage, power factor, loading, and generation values on a horizontal scale.
Hydroelectric Facilities
Multilayer gauge designs for flow rate, reservoir level, penstock pressure, turbine load, and other analog process values.
Manufacturing Facilities
Monitoring values such as line speed, production volume, temperature, pressure, motor load, and process capacity.
Water and Wastewater
Displaying tank/level, flow, pressure, and pump operating values together with colored ranges.
Temperature and Pressure
Visually distinguishing normal, warning, and high-value zones using RANGE components.
Performance Indicators
Comparing targets, actual values, and limits on the same horizontal scale using multiple pointers.
Industrial design approach:
Horizontal gauge design should consider not only visual appearance, but also scale
readability, clarity of value ranges, the ability to distinguish pointers from one
another, and the operator's ability to recognize critical information quickly.
Creating Gauges for a Template Library
An important use of HORIZONTAL_FRAME is that gauges created during the design phase can
later be added to a template library and reused on SCADA screens.
Instead of repeatedly creating similar indicators within the same facility or project,
this approach allows standardized visual components to be reused as ready-made templates.
- Identify the process values for which the gauge will be used.
- Determine the control's exact dimensions at the beginning of the design process.
- Create the scale bar and define the start/end values.
- Define normal, warning, and critical zones using the RANGE collection.
- Add one or more POINTER components for actual, target, or reference values.
- Add numeric frame, LED, and label layers if required.
- Configure color, gradient, border, and shadow properties.
- Add the finished design to the template library for reuse on SCADA screens.
Sizing rule:
Since HORIZONTAL_FRAME cannot be resized with the mouse, the width and height of a
library template must be determined in advance according to its intended use on the
actual SCADA screen. Using too many ticks, labels, and pointers in a gauge designed
too small may reduce readability.
Recommended Design Approach
Layered Design
First, create the body using HORFRAME. Then establish the measurement
axis with SCALEBAR. Highlight value zones using RANGE.
Position POINTER components for actual and target values. Finally,
add numeric and descriptive information using NUMFRAME,
LED, and LABEL components.
| Design Requirement |
Recommended Component |
Purpose |
| Basic body |
HORFRAME |
Create the horizontal visual frame of the gauge. |
| Scale |
SCALEBAR |
Convert the value range into a readable axis. |
| Normal/warning/critical zones |
RANGE |
Distinguish operating zones using color and width. |
| Actual value |
POINTER |
Display the current process value on the scale. |
| Target value |
Additional POINTER |
Display the target/reference value on the same axis. |
| Numeric value |
NUMFRAME |
Make the value readable in numeric form. |
| Digital display |
LED |
Create a segmented/digital display. |
| Description |
LABEL |
Add the process name, unit, or explanatory text. |
HORIZONTAL_FRAME is a comprehensive engine in EOS SCADA that is not
limited to creating a horizontal gauge as a single visual object. Instead, it combines
different component collections within the same design. This makes it possible to create
a wide range of designs, from a simple horizontal level indicator to an advanced process
gauge featuring multiple pointers and colored ranges.
This structure can be a powerful standardization tool, particularly when creating
template gauge libraries that are designed once and reused. However,
because the control cannot be resized with the mouse, the dimensions must be
decided at the very beginning of the design process.
Summary:
HORIZONTAL_FRAME = horizontal body + scale + color ranges + multiple pointers +
numeric frame + LED + labels. These components can be combined to create
specialized, reusable EOS SCADA gauge templates.