
Free Software Download Center
Software for industrial data collection, monitoring, and analysis.
EOS SCADA • NEROBAR • PROGRESS BAR + SCALE • USER CONTROL
NEROBAR is an EOS SCADA user control that displays a numerical process value using a linear fill bar while also adding a scale, divisions, thresholds, segments, and value information to the bar.
NEROBAR can therefore be considered an alternative to conventional linear indicators. By combining the fill visualization of a progress bar with the scale readability of a graduated linear indicator, it presents both the magnitude of the value and its position on the scale within the same area.

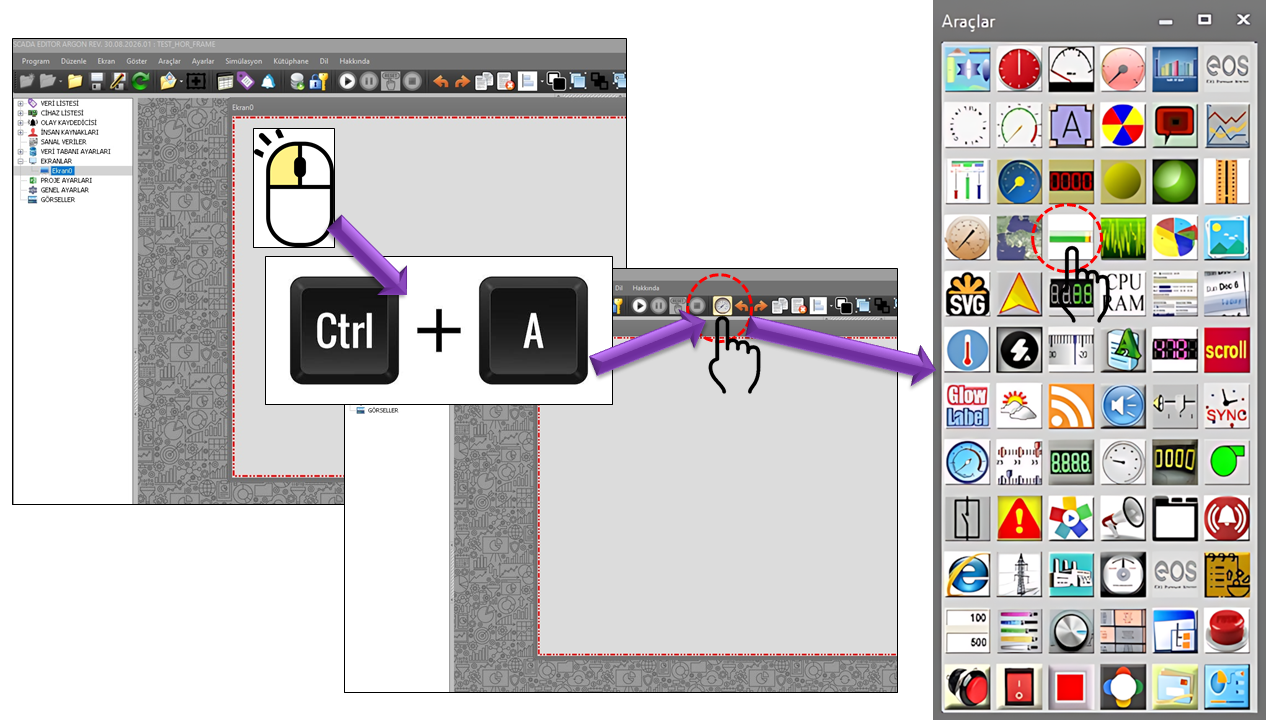
NEROBAR is a User Control designed to display a linear process value as a fill bar while keeping the scale information visible. The DisplayRuler, MajorInterval, Divisions, and RulerWidth properties in the source code show that the ruler layer can be configured independently.
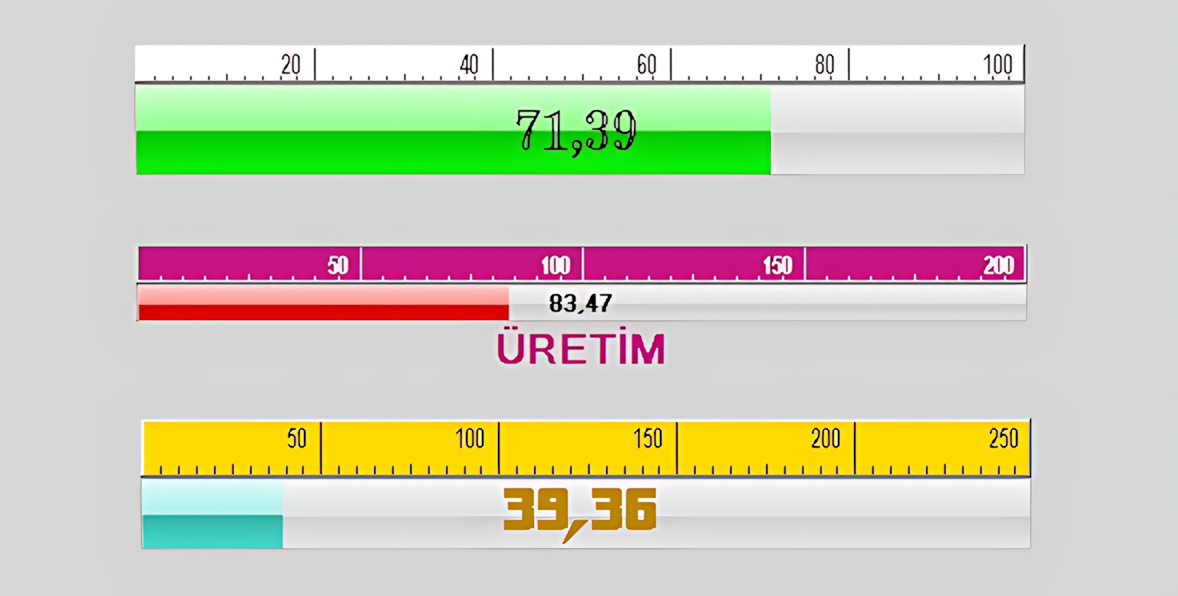
The distinguishing feature of this control is not merely that it produces a colored bar. One, two, or three segments can be defined using SegmentCount, and different process ranges can be visually distinguished through segment colors and thresholds. This allows regions such as normal operation, warning, and high values to be understood at a glance within the same display.
NEROBAR is an alternative visual approach that can be used alongside linear indicators such as MACTRACKBAR. MACTRACKBAR emphasizes the position of a value using a tracker/marker on a scale, whereas NEROBAR makes the fill level and threshold/segment colors more prominent. These two approaches allow the same process value to be presented according to different operator needs.
Example: A linear display with a range of 0–100, a value of 68, three colored segments, and a ruler.
NEROBAR's basic visual workflow involves evaluating the connected process value within the specified MinValue and MaxValue range, displaying its corresponding position on the bar, and associating any segment/threshold information with the visual representation. ValueMultiplier scales the displayed value by a multiplier.
When DisplayRuler is enabled, a ruler layer can be displayed alongside or over the linear bar. Its appearance can be configured using RulerWidth, RulerBackColor, RulerForeColor, RulerFont, and RulerBorderStyle.
MajorInterval determines the major interval value. This value directly affects the readability of the scale.
Divisions determines how many divisions the scale contains. More divisions provide a more detailed ruler display.
MiddleMarkFactor is the factor used to determine the behavior of the middle mark on the ruler.
Default values in the source code: DisplayRuler = true, MiddleMarkFactor = 4, MajorInterval = 20, Divisions = 10, and RulerWidth = 20.
Up to three different color regions can be created in NEROBAR using SegmentCount. Unlike a bar that progresses in a single color, this feature divides the process range into visual regions. For example, the segments can be configured as a green normal region, a yellow warning region, and a red high-value region.
A simple, single-color progress bar appearance is provided. It can be used together with the ruler and value display.
Two different operating regions can be created. Segment2Threshold defines the threshold at which the second region begins.
Three different visual ranges can be defined, such as normal, warning, and high/alarm regions. Segment3Threshold defines the threshold for the third region.
Using green/yellow/red colors is only a visual example. In an actual project, the meaning of each color should be defined consistently with the process alarm and operating philosophy.
One important usage feature of NEROBAR is that segment boundaries are not limited to fixed values specified only during design. In addition to configuration values such as Segment2Threshold and Segment3Threshold, the presence of data fields named DataThreshold1Measured and DataThreshold2Measured in the source code indicates that threshold information can also be handled using measured/data-side values.
This approach allows the same NEROBAR design to be used with different threshold values under different operating conditions. For example, if thresholds need to change according to an equipment operating recipe, product type, or process state, the relevant threshold information can be supplied by the SCADA data structure.
In a tank-level indicator, the normal operating limit may be fixed, while warning and high-level limits may vary for different products. In this case, NEROBAR can retain the same visual area while allowing threshold values to change dynamically with the data. This makes it possible to use a common display instead of designing a separate indicator for each product.
GradientMode provides two different color behaviors. With the Segments option, color behavior is handled through the segments, whereas the Wholebar option handles the color behavior of the entire bar as a whole.
| Option | Meaning | Description |
|---|---|---|
Segments |
Segments | Associates color changes with the segment regions. |
Wholebar |
Whole Bar | Handles color behavior across the entire bar. |
ColorThresholds controls the association of thresholds with colors, while DrawThresholds controls whether thresholds are drawn visually.
GlowMode highlights the display using a specific glow behavior. The source code defines three options:
| Option | Meaning | Description |
|---|---|---|
None |
None | No glow effect is used. |
Progressonly |
Progress Only | The glow effect is applied only to the advancing/filled portion. |
Wholebar |
Whole Bar | The glow effect is applied to the entire bar. |
GlowPause determines the pause duration, while GlowSpeed determines the glow speed. Their default values are 5000 ms and 20, respectively.
The display of the current process value can be enabled or disabled using DisplayValue. When DisplayLabel is enabled, a descriptive label can be placed on the control. The label text is configured using LabelText, its width using LabelWidth, its color using LabelForeColor, and its font using LabelFont.
The options defined in the source code for LabelAlignment are Top Left and Bottom Right. LabelFormat is used to format the value label.
In industrial HMI/SCADA systems, bar graphs and scaled linear indicators are common visualization approaches for presenting numeric process values graphically. The current Siemens WinCC Unified documentation includes features for the Bar object such as a labeled value scale, process value indicator, threshold values, and segmented scales. Rockwell Automation also describes bar graphs as graphics that display a controller value by filling a bar.
The fill percentage and the position on the engineering-unit scale can be monitored together.
Normal, warning, and high operating regions for pressure or flow can be distinguished using segment colors.
The operating range and critical thresholds of a temperature value can be read on a single linear display.
Values such as load percentage or current can visually emphasize operating regions above normal levels.
Instantaneous production, flow rate, or speed values can be presented together with ruler and fill information.
Comparing power, consumption, or similar continuous values against defined operating ranges can be made easier.
These applications are based on evaluating the properties in NEROBAR's source code together with the general approach to industrial bar-graph visualization. The thresholds and color meanings used in a particular project should be defined according to the process design. Industrial documentation also shows that process values, minimum/maximum scales, and thresholds can be used together in bar graphs.
| Technical Property | Meaning | Default Value | Description |
|---|---|---|---|
UCType |
Control Type | NEROBAR |
The type of the User Control. |
UpdateInterval |
Update Interval | 1000 | The control's data update interval. |
DecimalPoint |
Decimal Places | 0 | The number of decimal places used to display values. |
UCBackColor |
Control Background Color | Transparent | The background color of the control. |
UCForeColor |
Control Text Color | Black | The color of the control's text. |
UCFont |
Control Font | Arial Narrow 8.25 Bold | The control's general font. |
GradientMode |
Gradient Mode | Segments | Whether color behavior is handled through segments or the entire bar. |
DisplayRuler |
Display Ruler | true | Controls the visibility of the ruler layer. |
MiddleMarkFactor |
Middle Mark Factor | 4 | Configures the ruler's middle mark. |
MajorInterval |
Major Interval | 20 | The major scale interval. |
Divisions |
Divisions | 10 | The number of ruler divisions. |
ValueMultiplier |
Value Multiplier | 1 | The multiplier applied to the displayed value. |
LabelFormat |
Label Format | "" | The value/label formatting string. |
RulerWidth |
Ruler Width | 20 | The width of the ruler area. |
DisplayValue |
Display Value | true | Controls whether the current value is displayed. |
| Technical Property | Meaning | Default | Description |
|---|---|---|---|
DrawThresholds |
Draw Thresholds | true | Controls whether thresholds are drawn visually. |
ColorThresholds |
Color Thresholds | false | Controls whether thresholds are used in color behavior. |
SegmentCount |
Segment Count | One | Selects one, two, or three segments. |
MinValue |
Minimum Value | 0 | The lower limit of the display range. |
MaxValue |
Maximum Value | 100 | The upper limit of the display range. |
Segment1Color |
Segment 1 Color | Lime | The color of the first segment. |
Segment2Color |
Segment 2 Color | Yellow | The color of the second segment. |
Segment2Threshold |
Segment 2 Threshold | 50 | The threshold value for the second segment. |
Segment3Color |
Segment 3 Color | Red | The color of the third segment. |
Segment3Threshold |
Segment 3 Threshold | 100 | The threshold value for the third segment. |
DataThreshold1Measured |
Measured Data for Threshold 1 | "" | Measured threshold information received from the data side. |
DataThreshold2Measured |
Measured Data for Threshold 2 | "" | The second measured threshold value received from the data side. |
| Technical Property | Meaning | Default | Description |
|---|---|---|---|
DisplayLabel |
Display Label | false | Controls whether the label is displayed. |
LabelAlignment |
Label Alignment | Left_top | The Top Left or Bottom Right position. |
LabelText |
Label Text | "" | The description to be displayed. |
LabelWidth |
Label Width | 28 | The width of the label area. |
LabelForeColor |
Label Foreground Color | Black | The label text color. |
LabelFont |
Label Font | Arial Narrow 8.25 Bold | The label font. |
RulerBorderStyle |
Ruler Border Style | Raised | The appearance of the ruler border. |
RulerBackColor |
Ruler Background Color | White | The ruler background color. |
RulerForeColor |
Ruler Foreground Color | Black | The ruler text/mark color. |
RulerFont |
Ruler Font | Arial Narrow 6.75 Regular | The ruler font. |
The options defined in the NEROBAR source code are translated below. Technical names are preserved to allow them to be matched with the source code.
| Technical Value | Meaning |
|---|---|
Segments |
Segments |
Wholebar |
Whole Bar |
| Technical Value | Meaning |
|---|---|
One |
One |
Two |
Two |
Three |
Three |
| Technical Value | Meaning |
|---|---|
None |
None |
Progressonly |
Progress Only |
Wholebar |
Whole Bar |
| Technical Value | Meaning |
|---|---|
Left_top |
Top Left |
Right_bottom |
Bottom Right |
| Technical Value | Meaning |
|---|---|
Raisedouter |
Raised Outer |
Raisedinner |
Raised Inner |
Raised |
Raised |
Sunkenouter |
Sunken Outer |
Sunkeninner |
Sunken Inner |
Sunken |
Sunken |
Etched |
Etched |
Bump |
Bump |
Adjust |
Adjusted |
Flat |
Flat |
NEROBAR can be used on screens where continuously changing analog values need to be displayed in a single horizontal or vertical area, showing magnitude, scale, and status region together.
When segment boundaries can be changed using SCADA data, a single NEROBAR design can be adapted to different equipment, products, or operating conditions. This is a useful design approach, especially in projects where the same screen template is used for many similar process objects.
| Approach | Key Visual Information | Difference from NEROBAR |
|---|---|---|
| Basic linear indicator | Value position on the scale | NEROBAR makes fill level and segment colors more prominent. |
| Progress bar | Amount filled | NEROBAR adds ruler and threshold layers to the progress bar appearance. |
| Linear indicator with a ruler | Value + scale | NEROBAR extends this approach with segment, threshold, and glow options. |
NEROBAR combines the visual strengths of a conventional progress bar and a linear indicator with a ruler. It displays the process value as a fill level while providing a numerical scale through the ruler; distinguishes operating regions using one, two, or three segments; draws thresholds and associates them with colors; and highlights critical information through glow and label options.
It can be positioned as a distinct approach within the linear indicator family, particularly on SCADA screens where regions such as normal–warning–critical need to be recognized quickly within the same linear display.
Free Software Download Center
Software for industrial data collection, monitoring, and analysis.

Technical Support
Software documentation, sample code, and practical technical information.
You can contact us regarding EOS software, technical documentation, or industrial data communication.