Quick Visual Assessment
Instead of reading numerical values individually, the operator can directly see the shape of the change on the graph.
EOS SCADA • PERF_MONITOR • PERFORMANCE GRAPH
PERF_MONITOR is a performance monitor designed to track changes in SCADA data over time using a graph. Its primary purpose is to provide operators and maintenance personnel with a visual representation not only of the current numerical value of a process variable, but also of how that value changes over time.
This approach makes it possible to quickly identify whether a process variable is rising, falling, operating steadily, or fluctuating on a SCADA screen. In real-world industrial HMI/SCADA applications, trend graphs are widely used to monitor process variables over time and support performance analysis and diagnostics.

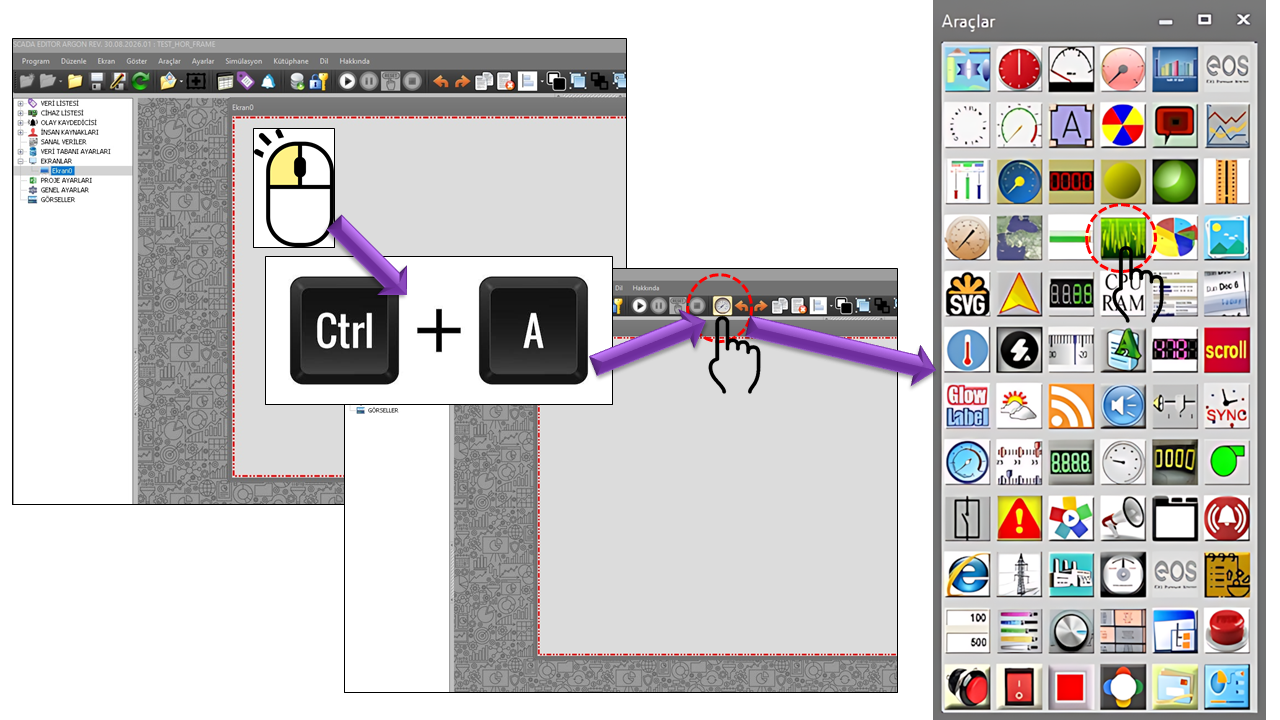
The working area of PERF_MONITOR is a graphical display consisting of a performance curve on a background and grid lines that make the curve easier to read. In the source code, the graph line, average line, and horizontal and vertical grid lines can each be configured independently.
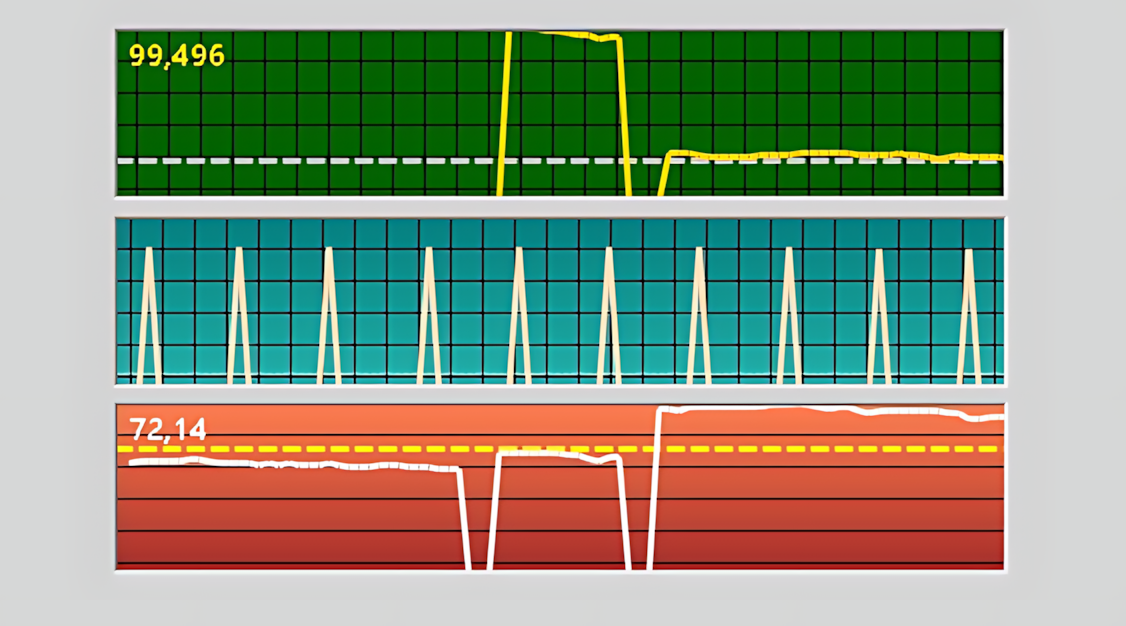
The instantaneous value of a SCADA variable alone may provide limited information about process behavior. A performance graph makes the value's trend over time visible, helping the operator more easily assess the direction of change, fluctuations, and steady-state operation.
In industrial HMI/SCADA documentation, trend graphs are used to visualize real-time process data, examine changes over time, and support performance evaluation and diagnostics. Some systems also provide multiple curves, a time axis, grid lines, and auxiliary visual elements such as average or limit indicators on the same graph.
Monitoring performance in SCADA systems involves more than simply indicating whether a machine is running or stopped. The behavior of an analog process value over time is an important source of visual information for evaluating the effects of settings, load changes, stability, and unexpected fluctuations.
Instead of reading numerical values individually, the operator can directly see the shape of the change on the graph.
The graph makes it easier to identify whether a value is stable or exhibits continuous fluctuations.
The upward or downward trend of a value over time can be visually tracked.
A performance graph can help determine when a change began during maintenance and process investigations.
The supplied source code defines the graphical display and time measurement options of PERF_MONITOR; it does not define a separate historical database or archiving mechanism. Therefore, this page is based on the behavior visible in the control's source code. For long-term and reliable historical recording, the SCADA system's separate data logging and archiving mechanisms should be considered. Industrial trend systems can make a similar distinction between online trends and persistent historical records.
Three visual layers are particularly important in the graphical display of PERF_MONITOR: the data graph, the average line, and the grid lines. Each of these layers can be configured independently with different colors, line styles, and widths.
The graph line represents changes in SCADA data. The horizontal axis represents time, while the vertical axis represents the measured value. Grid lines make the graph easier to read; when the average line is enabled, the relationship between the average value and the instantaneous curve can be visually monitored.
The ScaleMode property determines the scaling approach used to display graph values. The source code defines two options: Absolute and Relative.
With the Absolute option, the graph is evaluated using the absolute scale of the data's own numerical values. This approach is useful for processes that require monitoring within a fixed engineering range.
With the Relative option, the display uses a relative scaling approach. This can be used when changes need to be examined visually in relation to their own operating range.
The source code explicitly defines the options for ScaleMode; however, the detailed mathematical algorithm used to calculate relative scaling is not included in the supplied code excerpt. Therefore, no specific formula has been assumed here.
Two different time settings are noteworthy in PERF_MONITOR: UpdateInterval and TimerInterval. In addition, TimerMode determines the time measurement behavior to be used.
| Property | Default | Description |
|---|---|---|
UpdateInterval |
1000 | The general update interval of the user control. |
TimerInterval |
100 | The interval used for time measurement. |
TimerMode |
Disabled | Determines whether time measurement is disabled or uses Simple, Synchronized Average, or Synchronized Sum mode. |
If time measurement is enabled, the sampling and update intervals should be selected to suit the rate of change of the SCADA data being monitored. For industrial trend controls, it is recommended that the sampling rate be compatible with the update rate of the controller data; unnecessarily frequent sampling can lead to redundant data requests. citeturn0search12
When ShowAverageLine is enabled, an auxiliary line representing the average level can be added to the performance graph. The default value in the source code is true, and the line's default color is Silver, its width is 1, and its line style is Dash.
The average line helps display the overall level of the curve against a single horizontal reference. The portions of the curve that remain above or below this line can make it easier to assess performance behavior quickly.
In PERF_MONITOR, horizontal and vertical grid lines can be enabled independently. This divides the graph area into readable sections along both the time and value axes.
Controlled by ShowVerticalGridLines. It is enabled by default and can be styled using VerticalGridDashStyle, VerticalGridColor, and VerticalGridWidth.
Controlled by ShowHorizontalGridLines. It is enabled by default and can be styled using HorizontalGridDashStyle, HorizontalGridColor, and HorizontalGridWidth.
Grid lines do not represent the data itself; they provide visual references that make it easier to determine positions on the graph. In trend graphs, grids are commonly used to support readings along the value and time axes.
The appearance of PERF_MONITOR is determined by more than the graph line alone. The upper and lower background colors, graph line color and width, average line style, grid lines, and border style all contribute to the overall appearance of the graph.
| Visual Group | Properties | Default |
|---|---|---|
| Background | BackgroundColorTop, BackgroundColorBottom |
DarkGreen / DarkGreen |
| Data Graph | ChartLineColor, ChartLineWidth, ChartLineDashStyle |
Gold / 1 / Solid |
| Average | AvgLineColor, AvgLineWidth, AvgLineDashStyle |
Silver / 1 / Dash |
| Vertical Grid | VerticalGridColor, VerticalGridWidth, VerticalGridDashStyle |
Black / 1 / Solid |
| Horizontal Grid | HorizontalGridColor, HorizontalGridWidth, HorizontalGridDashStyle |
Black / 1 / Solid |
| Border | BorderStyle |
Sunken |
The following table is based on the general and graphical properties in the supplied PERF_MONITOR source code.
| Property | English Equivalent | Default | Description |
|---|---|---|---|
UCType |
Control Type | PERF_MONITOR | Specifies the type of the user control. |
UpdateInterval |
Update Interval | 1000 | The general update interval of the control. |
DecimalPoint |
Decimal Places | 0 | The number of decimal places used for numerical display. |
UCBackColor |
Control Background Color | Transparent | The control's primary background color setting. |
UCForeColor |
Control Text Color | Black | The control's primary text color. |
UCFont |
Control Font | Segoe UI 9 | The control's primary font. |
ScaleMode |
Scaling Mode | Absolute | Determines whether the graph uses Absolute or Relative scaling. |
TimerInterval |
Timer Interval | 100 | The interval used for time measurement. |
TimerMode |
Timer Mode | Disabled | Determines the time measurement behavior. |
ShowAverageLine |
Show Average Line | true | Determines whether the average line is displayed on the graph. |
AvgLineDashStyle |
Average Line Style | Dash | The line style used for the average line. |
AvgLineColor |
Average Line Color | Silver | The color of the average line. |
AvgLineWidth |
Average Line Width | 1 | The thickness of the average line. |
BorderStyle |
Border Style | Sunken | The border appearance of the graph control. |
BackgroundColorTop |
Upper Background Color | DarkGreen | The upper color component of the graph background. |
BackgroundColorBottom |
Lower Background Color | DarkGreen | The lower color component of the graph background. |
ChartLineColor |
Graph Line Color | Gold | The color of the line representing SCADA data. |
ChartLineWidth |
Graph Line Width | 1 | The thickness of the graph line. |
ChartLineDashStyle |
Graph Line Style | Solid | The line style used for the graph line. |
ShowVerticalGridLines |
Show Vertical Grid Lines | true | Controls the visibility of the vertical grid. |
VerticalGridDashStyle |
Vertical Grid Line Style | Solid | The style of the vertical grid lines. |
VerticalGridColor |
Vertical Grid Color | Black | The color of the vertical grid lines. |
VerticalGridWidth |
Vertical Grid Width | 1 | The thickness of the vertical grid lines. |
ShowHorizontalGridLines |
Show Horizontal Grid Lines | true | Controls the visibility of the horizontal grid. |
HorizontalGridDashStyle |
Horizontal Grid Line Style | Solid | The style of the horizontal grid lines. |
HorizontalGridColor |
Horizontal Grid Color | Black | The color of the horizontal grid lines. |
HorizontalGridWidth |
Horizontal Grid Width | 1 | The thickness of the horizontal grid lines. |
The PERF_MONITOR source code defines three main option sets and an additional option set for border styles.
| Value | English Equivalent | Description |
|---|---|---|
Absolute |
Absolute | Absolute scaling approach. |
Relative |
Relative | Relative scaling approach. |
| Value | English Equivalent | Description |
|---|---|---|
Disabled |
Disabled | Time measurement is disabled. |
Simple |
Simple | Simple time measurement approach. |
Synchronizedaverage |
Synchronized Average | Synchronized average approach. |
Synchronizedsum |
Synchronized Sum | Synchronized sum approach. |
| Value | English Equivalent | Description |
|---|---|---|
Solid |
Solid | A continuous line. |
Dash |
Dashed | A line made up of short dashes. |
Dot |
Dotted | A dotted line. |
Dashdot |
Dash-Dot | A repeating dash-and-dot pattern. |
Dashdotdot |
Dash-Dot-Dot | A repeating dash-and-two-dots pattern. |
Custom |
Custom | A custom line style. |
| Value | English Equivalent |
|---|---|
Raisedouter |
Raised Outer |
Raisedinner |
Raised Inner |
Raised |
Raised |
Sunkenouter |
Sunken Outer |
Sunkeninner |
Sunken Inner |
Sunken |
Sunken |
Etched |
Etched |
Bump |
Bump |
Adjust |
Adjust |
Flat |
Flat |
The applications of performance/trend graphs such as PERF_MONITOR can be extended according to the process significance of the monitored variable. The examples below do not assume that the PERF_MONITOR control in the source code is connected to a specific process; they are example scenarios based on common industrial uses of SCADA trend graphs. Manufacturer documentation also describes the use of trend graphs to monitor production processes and display values from controller tags over time.
The stability of furnace, tank, ambient, or process temperature can be monitored over time.
Fluctuations and trends in pressure or flow can be examined on the graph.
The time-dependent behavior of power, current, voltage, or load-related values can be monitored.
Analog performance variables and operating behavior associated with a machine can be visually tracked.
Changes in tank levels and similar analog process variables can be monitored.
A graphical history view can help determine when unexpected changes began.
The graph line, background, and grid lines should be sufficiently distinct. The Gold graph line provides strong visual contrast against the default DarkGreen background.
Excessively dense grid lines can make data harder to read. The grid should be treated as a visual aid that does not compete with the curve.
The choice between Absolute and Relative scaling should be based on the type of performance information the operator needs to see.
The TimerInterval and TimerMode settings should be evaluated according to the rate of change of the monitored variable.
For example, suppose you want to monitor the pressure value of a pump. You can display the pressure data as a graph line in PERF_MONITOR, keep the horizontal and vertical grids enabled to make the graph easier to read, and enable the average line to provide a visual reference for the general operating pressure. This makes it possible to assess changing behavior on the same screen as the numerical value.
PERF_MONITOR is a user control that plots SCADA data as a graph on a performance screen and offers detailed configuration of its visual properties. By combining the graph line, average line, horizontal and vertical grids, scaling, and time measurement, the behavior of data over time can be made easier to understand.
The control's greatest strength is that it does not merely display a value; it makes the change itself visible. For this reason, it can provide a meaningful graphical display layer for process monitoring, performance evaluation, and maintenance/diagnostic screens.
Since the supplied source code does not define a historical data archiving mechanism, the functions described here are limited to the graphing, time measurement, and visual configuration features evident in the source code.
Free Software Download Center
Software for industrial data collection, monitoring, and analysis.
Technical Support
Software documentation, sample code, and practical technical information.
You can contact us regarding EOS software, technical documentation, or industrial data communication.