MW Measurement
The generation MW Measured value is acquired continuously.
PRIMARY FREQUENCY CONTROL PERFORMANCE MONITORING AND ANALYSIS
PFC ANALYSIS PANEL is a specialized user control designed to enable hydroelectric power plant operating personnel to monitor and evaluate Primary Frequency Control (PFC) performance in real time through the SCADA screen.
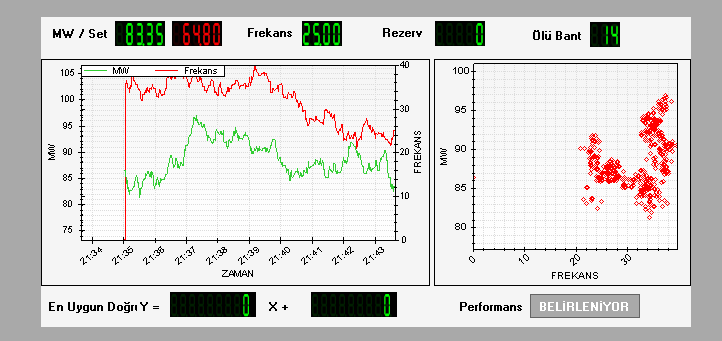
By continuously acquiring data on generation power, grid frequency, MW setpoint, deadband, and primary reserve, the control provides real-time analysis using two separate graphs. The left graph displays behavior over time, while the right graph shows the scatter distribution of the MW–frequency relationship and the linear regression applied to these data points.

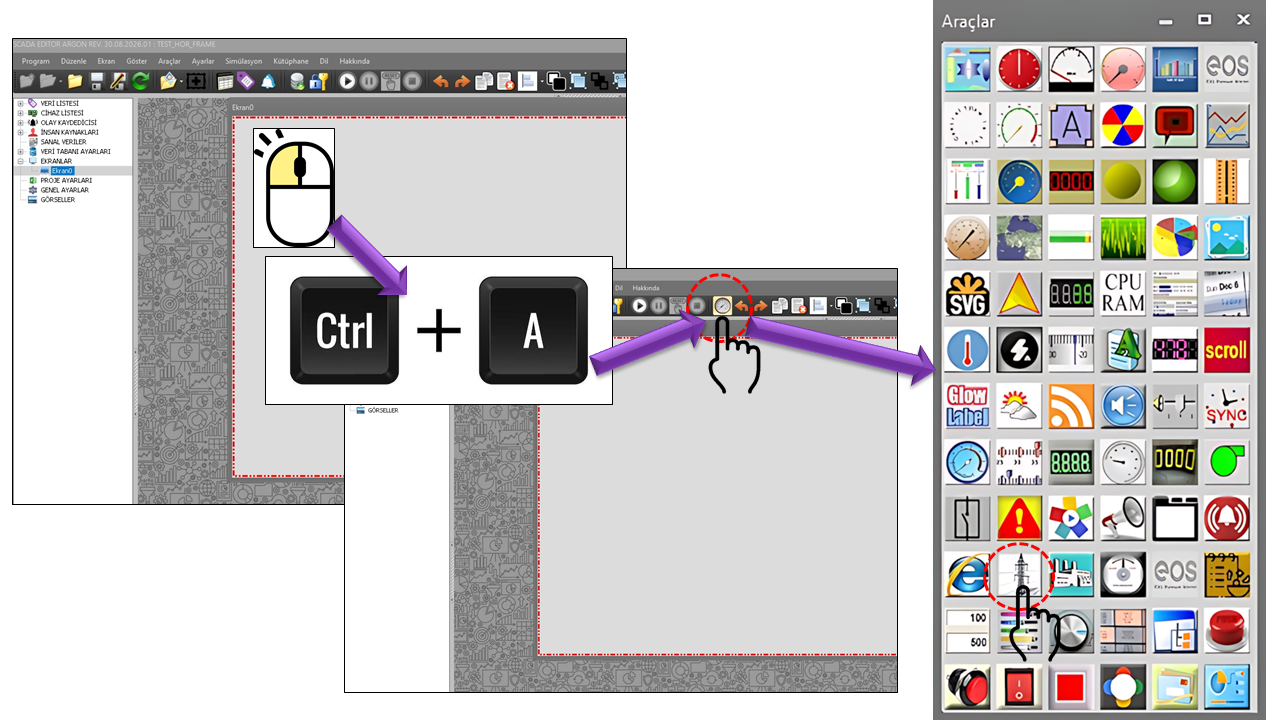
Primary Frequency Control is one of the first automatic frequency responses that helps stabilize system frequency by automatically adjusting the active power output of generation sources in response to changes in system frequency caused by instantaneous imbalances between power generation and consumption. ENTSO-E documents explain that the purpose of primary control is to help bring system frequency to a stable value within seconds following a disturbance, but not to restore frequency and power exchanges to their initial reference values on its own.
In Türkiye, Primary Frequency Control is one of the services provided under TEİAŞ's Ancillary Services. TEİAŞ publishes Primary Frequency Control Service as a separate ancillary service on its current webpages. It also states that the data formats recorded in minutes, reports, and performance tests related to the PFK service are updated in line with regulatory changes.
The main purpose of this control is to consolidate live SCADA data related to PFK on a single screen, making the measurement → relationship → regression → performance sequence visible to the operator.
When the balance between generation and consumption in an electrical power system is disrupted, the system frequency deviates from its nominal value. Primary control limits the effects of this imbalance by enabling generating plants to respond automatically to frequency deviations and helps the frequency move toward a new stable operating point. ENTSO-E load-frequency control documents explain that frequency deviations result from imbalances between generation and demand, and that primary control responds automatically to these deviations.
Two important concepts in primary control are droop (static characteristic/slope) and primary control reserve. ENTSO-E documents define generator droop as the proportional relationship between frequency changes and unit active power changes. Primary control reserve refers to the relevant portion of the available primary control range from the current operating point.
The speed/frequency governor of a hydroelectric generating unit changes its active power output in response to changes in grid frequency. PFKANALYSIS focuses on monitoring this physical behavior through SCADA measurements and analyzing the measured MW–Frequency relationship.
For the control to operate properly, the following five data items must be connected from SCADA to the user control. The data fields in the source code directly define these connection points.
The generation MW Measured value is acquired continuously.
The grid Frequency Measured value is monitored.
MW Set, deadband, and primary reserve data are acquired.
Time trends and MW–Frequency scatter plots are generated.
Regression and control performance evaluation are made visible.
The Generation MW Measured, Grid Frequency Measured, Generation MW Set Measured, Measured Deadband, and Primary Reserve values must flow regularly and continuously from SCADA to the control. Interruptions, delays, or inaccurate measurements in this data flow may directly affect the reliability of the analysis results.
| Data | Source Field | Role in the Analysis |
|---|---|---|
| Generation MW Measured | DataMWMeasured |
Provides the measured active power value of the plant/unit. |
| Grid Frequency Measured | DataFrequencyMeasured |
Provides changes in grid frequency. |
| Generation MW Set Measured | DataMWSetMeasured |
Used to monitor the generation power reference. |
| Measured Deadband | DataDeadBandMeasured |
Brings deadband information related to PFK behavior into the analysis. |
| Primary Reserve | DataPrimaryReserveMeasured |
Brings the available primary reserve information into the analysis. |
The purpose of this control is not merely to display fixed values. Acquiring data from SCADA tags as continuously flowing measurements is fundamental to live trend and scatter analysis.
Two complementary graphs form the core of the PFKANALYSIS screen. They allow the same data to be interpreted from different perspectives: the graph on the left shows behavior over time, while the graph on the right reveals the relationship between MW and frequency.
| Graph | Display | Analysis Purpose |
|---|---|---|
| Left | MW and Frequency → Time | To monitor live process behavior and the temporal relationship between frequency and power changes. |
| Right | MW ↔ Frequency scatter plot | To view the distribution of measurement points and fit a linear regression line to them. |
The right-hand graph displays the measured MW and frequency values individually as scatter points. A first-degree linear regression approach is then used to represent the overall trend of these points.
According to the design in the source code, the "Best-Fit Line" area at the bottom of the screen is used to make the coefficients of the regression line visible to the operator. This allows the point cloud on the graph and the calculated linear characteristic to be evaluated on the same screen.
The regression line is a tool for summarizing the overall linear trend of the measurement points. The direction and magnitude of its slope provide information about the nature of the measured relationship between MW and frequency. Since the source code does not specify the intermediate mathematical formula used to calculate PERCENTGOODVALUE in PFKANALYSIS, this page does not assume a specific formula for that calculation.
The ReserveMarginType property determines which analytical approach is used to evaluate
the primary reserve margin. The source code provides the following three options.
| Enum Option | English | Description |
|---|---|---|
Constant |
Constant | The reserve margin is treated as a fixed value. |
Regression |
Regression | A regression-based approach is used in the analysis. |
Primaryreserve |
Primary Reserve | Primary reserve information is used as one of the reference elements in the analysis. |
| Property | Description in English | Default | Description |
|---|---|---|---|
UCType |
Control Type | PFKANALYSIS |
Defines the type of control. |
UpdateInterval |
Update Interval | 1000 |
The general data update interval for the control. |
DecimalPoint |
Decimal Places | 0 |
Specifies the number of decimal places used in numeric displays. |
ConstantMWset |
Constant MW Setpoint | false |
Determines whether the MW setpoint is treated as a fixed value. |
MWsetValue |
MW Setpoint Value | 0 |
The reference value used when a constant MW setpoint is enabled. |
ConstantDeadBand |
Constant Deadband | false |
Determines whether the deadband is treated as a fixed value. |
DeadBandValue |
Deadband Value | 0 |
The constant deadband value. |
ConstantPrimaryReserve |
Constant Primary Reserve | false |
Determines whether the primary reserve is treated as a fixed value. |
PrimaryReserveValue |
Primary Reserve Value | 0 |
The constant primary reserve value. |
InstalledPower |
Installed Capacity | 100 |
Defines the installed capacity value to be used in the analysis. |
ReserveMarginType |
Reserve Margin Analysis Type | Constant |
Selects the constant, regression, or primary reserve approach. |
AnalysisTimeInterval |
Analysis Time Interval | 5 |
The time interval parameter used for the analysis. |
DispayBorder |
Display Border | true |
Determines whether the control border is displayed. |
UseTrendData |
Use Trend Data | false |
Determines whether trend data is used in the analysis. |
MWThreshold |
MW Threshold | 3 |
The MW threshold parameter used in the analysis. |
PerformancePercent |
Performance Percentage | 0.5 |
A source code parameter used in the performance calculation process. |
GraphTimeInterval |
Graph Time Interval | Last30minutes |
Determines the time window displayed on the graph. |
DisplayZeroLine |
Display Zero Line | false |
Determines whether the zero reference line is displayed on the graphs. |
GraphTimeInterval is used to select the historical time window covered by the graphs.
The Enum Option values in the source code are listed below.
| Enum Option | English |
|---|---|
Last10minutes |
Last 10 Minutes |
Last30minutes |
Last 30 Minutes |
Last1hour |
Last 1 Hour |
Last3hours |
Last 3 Hours |
Last6hours |
Last 6 Hours |
Last12hours |
Last 12 Hours |
Last1day |
Last 1 Day |
The PERFCALCREG() function in the source code classifies the calculated
PERCENTGOODVALUE according to specific ranges and displays it on the screen
together with a status message. The following table explains the evaluation logic directly
implemented in the supplied code.
| PERCENTGOODVALUE | Displayed Status | Text in the Source Code |
|---|---|---|
< 0 |
Undefined | UNDEFINED |
>= 98 |
Excellent | EXCELLENT (%...) |
>= 95 and < 98 |
Very Good | VERY GOOD (%...) |
>= 90 and < 95 |
Good | GOOD (%...) |
>= 70 and < 90 |
Normal | NORMAL (%...) |
>= 50 and < 70 |
Fair | FAIR (%...) |
> 0 and < 50 |
Unsuccessful | UNSUCCESSFUL (%...) |
== 0 |
Being Determined | BEING DETERMINED |
This classification reflects the direct behavior of the supplied PERFCALCREG() code.
Since the shared code does not specify the physical/statistical formula used to calculate
PERCENTGOODVALUE, no additional assumptions about that formula have been made
on this page.
The information row at the top of the screen allows the operator to quickly view the key inputs for PFK analysis before examining the graphs. The regression line coefficients and performance status are presented together in the lower section. This means the screen functions not merely as a trend display, but also as a live analytical evaluation panel.
PFKANALYSIS provides a useful monitoring layer for evaluating the active power response of a turbine-generator unit to frequency changes on the operating screen, particularly in hydroelectric power plants. The operator can monitor generation MW, the MW setpoint, grid frequency, deadband, and primary reserve within the same context.
Changes in MW and frequency over time can be monitored on a single graph.
MW–Frequency measurement points can be examined in a scatter plot to reveal the linear trend.
A first-degree regression line can be fitted to the measurement points to monitor characteristic coefficients.
The performance percentage calculated by the control is presented to the operator together with the defined status categories.
The five key inputs must be connected to the correct tags and kept continuously up to date. Missing, frozen, time-unsynchronized, or physically inaccurate measurements may affect the regression distribution and, consequently, the performance evaluation.
The operating conditions under investigation should be considered when selecting the graph time interval. A window that is too short may lead to evaluation before enough data points are available, while a window that is too long may combine different operating conditions into the same scatter set.
PFKANALYSIS is a monitoring and analysis tool. The performance category shown on the screen is the result of the calculation logic in the source code; it should not be assumed to replace an official PFK performance report or test procedure based on regulations. TEİAŞ separately publishes current documents concerning PFK performance tests and report formats.
The enum options defined in the PFKANALYSIS source code are listed below.
| Enum Option | English Equivalent |
|---|---|
GNAnalizTuru.Constant |
Constant |
GNAnalizTuru.Regression |
Regression |
GNAnalizTuru.Primaryreserve |
Primary Reserve |
GNZamanAraligi.Last10minutes |
Last 10 Minutes |
GNZamanAraligi.Last30minutes |
Last 30 Minutes |
GNZamanAraligi.Last1hour |
Last 1 Hour |
GNZamanAraligi.Last3hours |
Last 3 Hours |
GNZamanAraligi.Last6hours |
Last 6 Hours |
GNZamanAraligi.Last12hours |
Last 12 Hours |
GNZamanAraligi.Last1day |
Last 1 Day |
The general explanations of Primary Frequency Control on this page are supported primarily by relevant technical and operational documents from TEİAŞ and ENTSO-E. For current regulations and official PFK implementation documents in Türkiye, the latest documents published by the relevant institution should always be used as the authoritative reference.
PFKANALYSIS is a specialized SCADA analysis control designed for a broader purpose than a conventional trend display. It acquires five key SCADA data items in real time; displays MW and frequency behavior over time; plots MW–Frequency measurements in a scatter graph; applies a linear regression approach to these points; and presents the calculated performance value to the operator together with its status.
Particularly in hydroelectric power plant operations, it provides an integrated performance monitoring approach that allows operators to observe the question "How does generation power respond when grid frequency changes?" on a live screen.
SCADA measurements → live trend → MW/Frequency scatter plot → linear regression → characteristic coefficients → performance percentage → status evaluation

Free Software Download Center
Software for industrial data collection, monitoring, and analysis.

Technical Support
Software documentation, sample code, and practical technical information.
You can contact us regarding EOS software, technical documentation, or industrial data communication.