Energy Distribution
Display the distribution of total energy generation among different generation sources or units.
EOS SCADA • PIE_CHART • LIVE DATA DISTRIBUTION • USER CONTROL
PIE CHART (PIE_CHART) is a user control that displays SCADA data representing multiple parts of a common total as a live pie chart. Each PIE_DATA_COLLECTION item creates a separate slice in the chart; the size of each slice visually represents the proportion of the associated value within the total.
The control can be configured in detail using properties such as slice color, offset, data title, tooltip, label format, 3D slice height, start angle, border, transparency, and shadow.

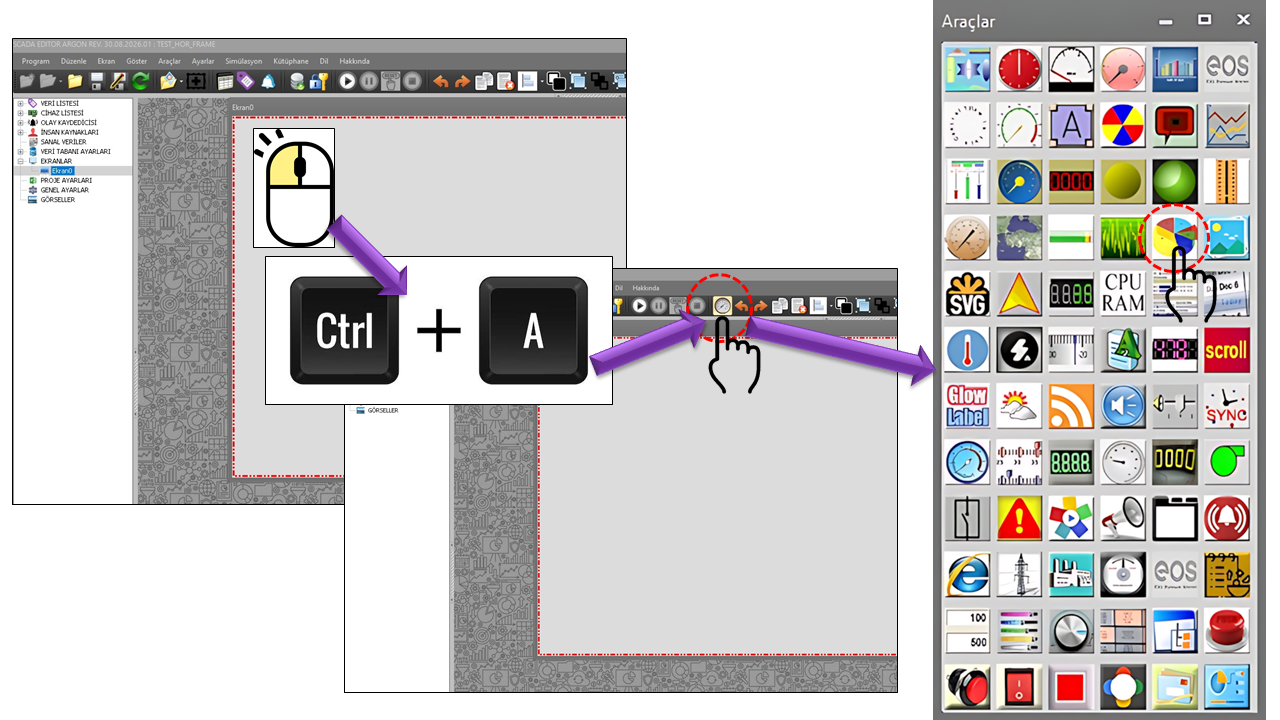
PIE CHART (PIE_CHART) is a user control engine developed to create live pie charts within the EOS SCADA design environment. In the EOS user control engine documentation, PIE CHART (PIE_CHART) is described as an engine that adds live pie charts to SCADA pages and offers a wide range of configurable properties.
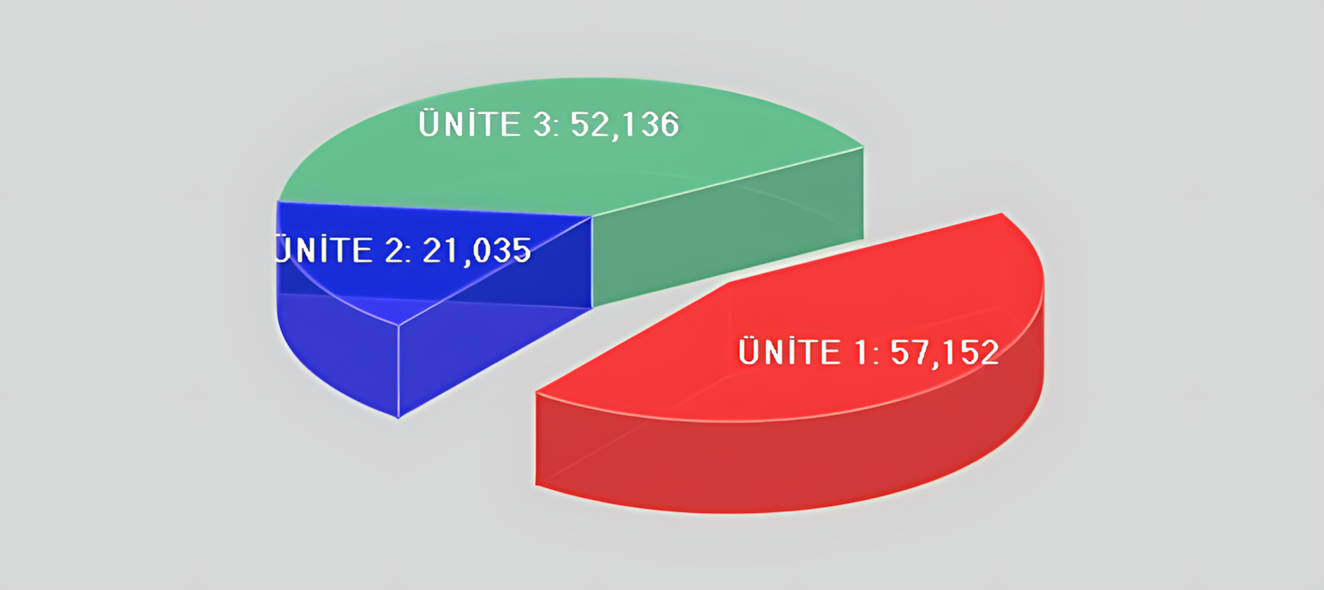
The fundamental data principle of a pie chart is to display the categories that make up a total as separate slices. Therefore, the data connected to PIE CHART (PIE_CHART) should not merely consist of different numerical values displayed on the same screen; they should represent meaningful parts of the same whole. In industrial SCADA applications, this approach supports visualizations such as the distribution of total generation among units, the distribution of total energy consumption by source, or the distribution of alarm categories over a specific period. Similar SCADA applications use pie charts to display process values and alarm distributions.
Basic principle: Each record in the PIE DATA COLLECTION (PIE_DATA_COLLECTION) represents a slice. A pie chart provides a meaningful comparison when the slice values can be interpreted as parts of the same whole.
PIE_DATA_COLLECTION is the primary data configuration for PIE CHART (PIE_CHART). Each collection item defines one pie slice. Therefore, adding SCADA data to the collection is one of the most important steps to complete before configuring the chart's visual design.
If the distribution of the instantaneous active power values of four generating units operating simultaneously at a hydroelectric facility is to be displayed as a share of total generation, Unit 1 MW, Unit 2 MW, Unit 3 MW, and Unit 4 MW can be defined as parts of the same whole. The pie slices then represent each unit's contribution to total generation.
| Pie Data Name | Connected SCADA Data | Pie Color | Meaning in the Chart |
|---|---|---|---|
| Unit 1 | UNIT1_MW |
Red | Unit 1's share of total generation |
| Unit 2 | UNIT2_MW |
Yellow | Unit 2's share of total generation |
| Unit 3 | UNIT3_MW |
Green | Unit 3's share of total generation |
| Unit 4 | UNIT4_MW |
Blue | Unit 4's share of total generation |
Data selection warning: Directly comparing different physical quantities in the same pie chart—for example, temperature in one slice, MW in another, and pressure in a third—does not establish a suitable data relationship. For PIE CHART (PIE_CHART), the slices must represent a common total or a common distribution.
| Technical Property | EOS English Equivalent | Default | Description |
|---|---|---|---|
_PieDataItems |
Pie Data Items | — | The collection of pie slices to be created in the chart. |
_PieDataName |
Pie Data Name | "" |
Defines the name of the relevant pie slice/data item. |
_PieColor |
Pie Color | Red |
Specifies the color of the relevant pie slice. |
_Offset |
Offset | 0 |
Specifies how far the relevant slice is separated from the pie center. |
_DataHeaderText |
Data Header Text | "" |
Defines the header text associated with the data item. |
_DataTooltipText |
Data Tooltip Text | "" |
Defines the tooltip text displayed for the data item. |
The UpdateInterval value of PIE CHART (PIE_CHART) is defined as 1000 ms. This is the default update interval specified in the control's source code. However, correct operation of a live pie chart depends not only on the timer but also on properly connecting SCADA data to the user control.
EOS SCADA action/function structure: EOS documentation states that the Valuechanged - Usercontrolspecific action-function pair should be used for the normal data-visualization function of user controls.
The visual structure of PIE CHART (PIE_CHART) is not limited to the colors of the pie slices. The properties in the source code allow the chart layout and 3D appearance to be configured separately.
| Property | EOS English Equivalent | Default | Function |
|---|---|---|---|
_FitChart |
Fit Chart | false |
Specifies whether the chart should be fitted within the available area. |
_LabelType |
Label Type | None |
Specifies the type of labels used on the pie slices. |
_SliceRelativeHeight |
Slice Relative Height | 0.25 |
Specifies the relative height/depth effect of the 3D pie slices. |
_InitialAngle |
Initial Angle | -30° |
Specifies the angle at which the pie slices begin to be drawn. |
_MarginSettings |
Margin Settings | 10,10,10,10 |
Specifies the margins around the chart. |
_EdgeColorType |
Edge Color Type | Noedge |
Specifies the edge appearance of the pie slices. |
_EdgeLineWidth |
Edge Line Width | 1 |
Specifies the width of the slice edge lines. |
_AlphaValue |
Alpha Value | 122 |
Specifies the transparency level of the pie chart. |
_ShadowStyle |
Shadow Style | Gradualshadow |
Specifies the shadow appearance of the 3D pie chart. |
Label selection allows pie slices to be distinguished not only by color but also by readable text and value information. The options for GNEtiketTuru in the source code are listed below.
| Technical Value | English Equivalent | Description |
|---|---|---|
None |
None | No slice label is displayed. |
Text |
Text | The defined text is displayed. |
Text_value |
Text and Value | Text and value are displayed together. |
Name |
Data Name | The pie data name is displayed. |
Name_value |
Data Name and Value | The data name and value are displayed together. |
Value |
Value | Only the value is displayed. |
If there are only a few slices and their meaning can be expressed directly through equipment names, the Data Name or Data Name and Value options can help operators interpret the chart quickly. On screens with many slices, the None option and a separate legend or explanatory area may be preferable to prevent labels from cluttering the chart.
| Technical Value | English Description |
|---|---|
Noedge |
No Edge |
Systemcolor |
System Color |
Surfacecolor |
Surface Color |
Darkerthansurface |
Darker Than Surface |
Darkerdarkerthansurface |
Much Darker Than Surface |
Lighterthansurface |
Lighter Than Surface |
Lighterlighterthansurface |
Much Lighter Than Surface |
Contrast |
Fixed Contrast |
Enhancedcontrast |
Enhanced Contrast |
Fullcontrast |
Full Contrast |
| Technical Value | English Description |
|---|---|
Noshadow |
No Shadow |
Uniformshadow |
Uniform Shadow |
Gradualshadow |
Gradual Shadow |
PIE CHART (PIE_CHART) is particularly useful on screens where the goal is to view the components of a total in real time. Considering EOS's live-chart user control approach alongside pie chart applications in other SCADA products, the following use cases are appropriate.
Display the distribution of total energy generation among different generation sources or units.
Monitor each generator or generating unit's contribution to total plant generation in real time.
Visually present the distribution of alarm categories for a defined scope or period.
Compare the shares of flows, sources, or process components that make up a total.
Display the proportions of operating, standby, or similar categories within a defined total group.
Summarize the current composition of a specific total in a single visual instead of using a detailed trend.
GNEtiketTuru selection should be based on screen size and the number of slices.SliceRelativeHeight, ShadowStyle, and AlphaValue can enhance visual impact, the readability of small slices must also be preserved.Offset can highlight a particular slice; unnecessarily separating all slices can reduce visual coherence.UpdateInterval = 1000 ms, data change frequency and screen performance should be considered together in the actual application.Operator screen warning: The primary purpose of pie charts is to summarize the components of a whole quickly. Other chart types may be more suitable when precise time-series comparisons, ranking closely spaced values, or detailed comparisons across many categories are required.
| Item | Value |
|---|---|
| Control Type | PIE CHART (PIE_CHART) |
| Update Interval | 1000 ms |
| Control Background Color | Transparent |
| Control Text Color | Black |
| Control Font | Arial Narrow, 8.25 pt, Bold |
| Pie Data Collection | PIE_DATA_COLLECTION[] |
| Fit Chart | false |
| Label Type | None |
| Slice Relative Height | 0.25 |
| Initial Angle | -30° |
| Margin Settings | 10, 10, 10, 10 |
| Edge Color Type | Noedge |
| Edge Line Width | 1 |
| Alpha Value | 122 |
| Shadow Style | Gradualshadow |
Conclusion: PIE CHART (PIE_CHART) is a live pie chart user control that visualizes related SCADA values as components of a single total rather than merely displaying their numerical values. PIE_DATA_COLLECTION is at the core of the control. When the data relationships are configured correctly, slice sizes, colors, labels, and 3D visual properties can be combined to provide operators with a quick overview of the distribution.

Free Software Download Center
Software for industrial data collection, monitoring, and analysis.

Technical Support
Software documentation, sample code, and practical technical information.
You can contact us regarding EOS software, technical documentation, or industrial data communication.