Free Software Download Center
Software for industrial data collection, monitoring, and analysis.
EOS SCADA • SSD_GOSTERGE • DIGITAL NUMERIC INDICATOR
SSD INDICATOR (SSD_GOSTERGE) is a segment-based numeric indicator user control designed to display process values on SCADA screens using a conventional digital numeric display format. It can serve as an alternative to similar digital numeric indicators and can be configured with its own settings, including digit count, segment colors, decimal display, sign, automatic scrolling, and thresholds.
One of the control's key features is Quick Graph support. When Quick Graph is enabled, a small icon appears in the lower corner of the control. When the mouse pointer hovers over this icon, a historical data trend for the selected time interval is displayed. The graph automatically disappears when the pointer moves away from the icon. This allows operators to quickly review the recent history of a monitored value without switching to a separate trend screen.

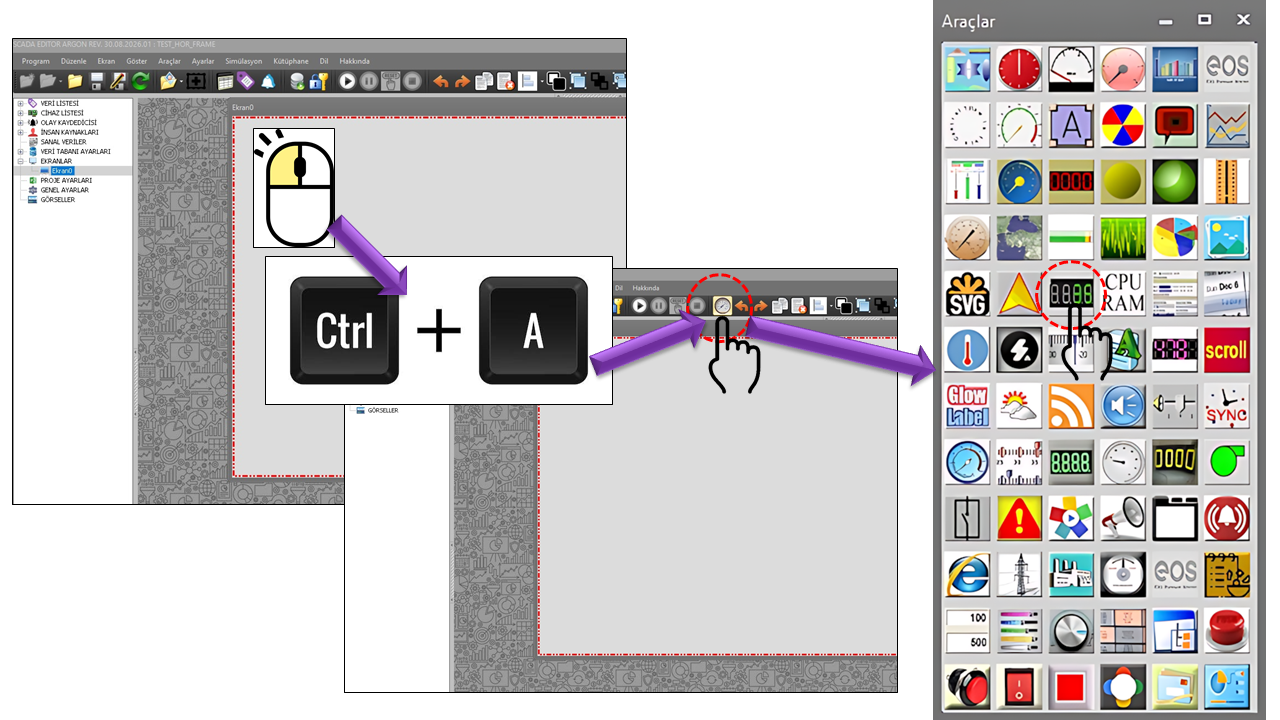
The DIGITAL NUMERIC DISPLAY (SSD DISPLAY) is used to
present the current numerical value of a data point in a digital display
area composed of segments. Properties such as DigitCount,
ElementWidth, SegmentColorOff, and
SegmentColorOn in the source code allow the visual
appearance of the display to be configured directly.
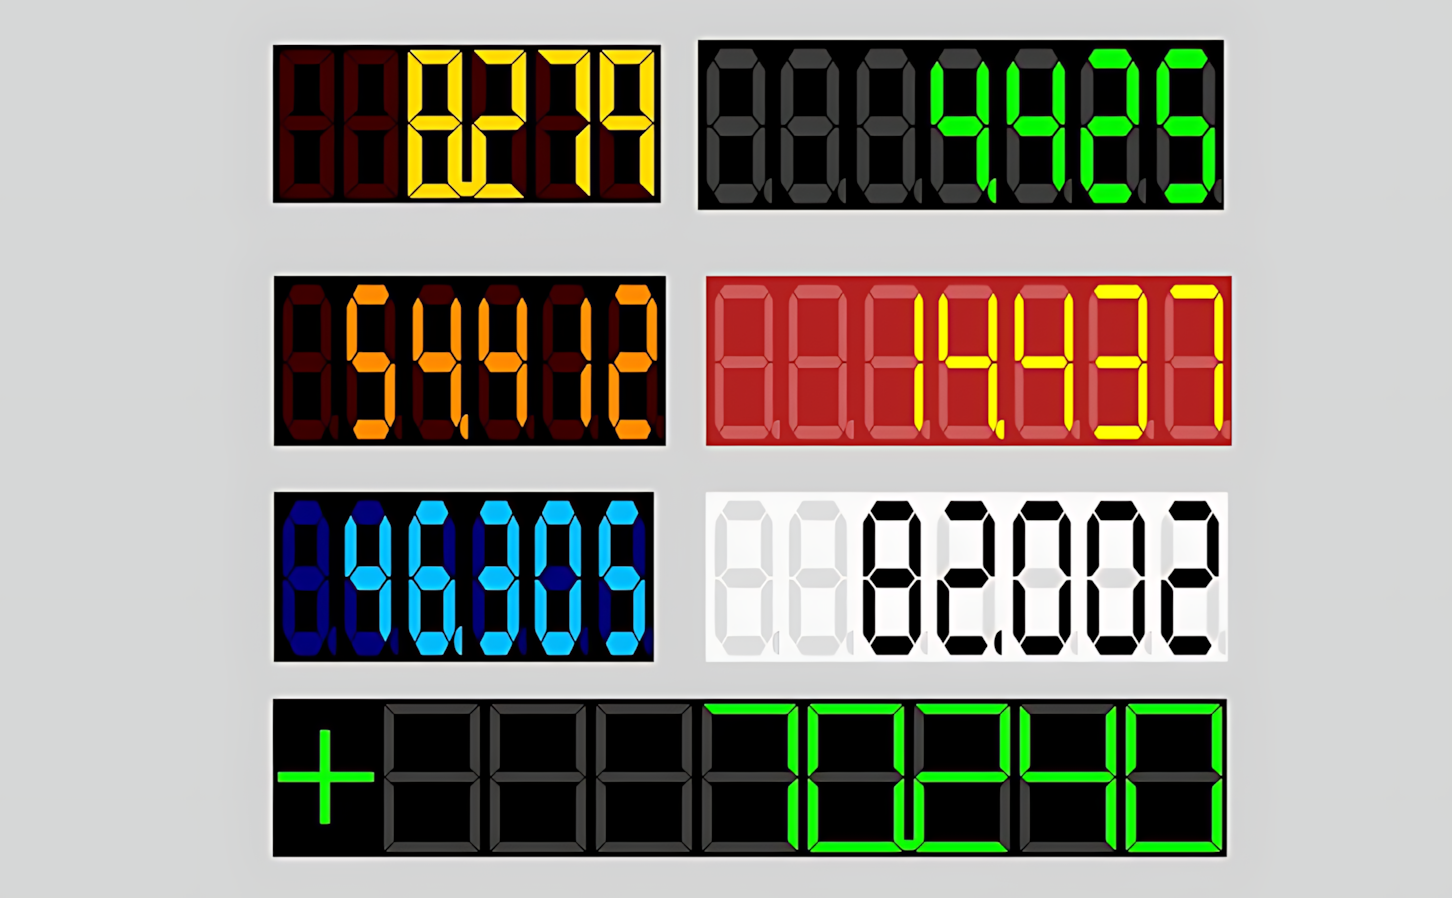
As shown in the illustration, inactive segments can be displayed in a dark color, while active segments can be highlighted in a bright color. This makes the displayed value easy to identify, especially on operator screens with dark backgrounds. The control's numerical display can be adapted to screens where numerical process information such as measured values, counters, speeds, temperatures, pressures, flow rates, and levels must be monitored continuously.
Key distinction: The SSD DISPLAY does more than simply display a number. Thanks to the Quick Graph feature, operators can quickly access the historical trend of the displayed value directly from the control. This feature is particularly useful for correlating the current numerical value with its recent behavior on the same screen.
The visual appearance of the numerical value can be configured using the segment on/off color settings.
Digital numeric displays are used on HMI screens to show the current value of a tag or numerical data point directly. Industrial HMI documentation describes numeric displays as a means of showing instantaneous process values such as temperature; 7-segment displays are also used to present status, parameter, and error codes. Rockwell Automation — Numeric Display and Schneider Electric — Integrated HMI / 7-segment display.
For compactly displaying the instantaneous numerical values of measurements such as temperature, pressure, flow rate, level, and speed.
For quickly presenting production counts, total quantities, operating counters, and similar numerical values to operators.
For monitoring motor speed, velocity, setpoints, and other equipment-related numerical information in a clear digital format.
When Quick Graph is enabled, the recent historical behavior of the current value can be accessed through the same user control.
In industrial HMI systems, trend views are used to examine process data over time and correlate it with historical values. Accordingly, the Quick Graph approach in the SSD DISPLAY reduces the transition from a numerical display to a trend view to a brief interaction for the operator. citeturn0search22turn0search1
The properties below represent the basic control settings defined for SSD_GOSTERGE in the source code. The English equivalents are based on the corresponding entries in the EOS terminology dictionary.
| Property | EOS Turkish Equivalent | Default | What Does It Do? | Where Is It Used? |
|---|---|---|---|---|
UCType |
Control Type | SSD_GOSTERGE |
Defines the type of the user control. | All screens where the SSD DISPLAY control is defined. |
UpdateInterval |
Update Interval | 1000 |
Determines the data update interval of the control. | For regularly refreshing instantaneous process values. |
DecimalPoint |
Decimal Places | 0 |
Determines the decimal-place display setting for the numerical value. | For displaying integer or decimal measurements. |
UCBackColor |
Control Background Color | Transparent |
Determines the background color of the control. | For maintaining visual consistency between the SCADA screen and the display. |
UCForeColor |
Control Foreground Color | Black |
Determines the primary text color of the control. | For the general textual elements of the control. |
UCFont |
Control Font | Arial Narrow, 8.25 pt, Bold |
Determines the font settings of the control. | For the textual elements displayed by the control. |
These properties determine the digital segment appearance of the SSD DISPLAY and how the value area is formatted.
| Property | EOS Turkish Equivalent | Default | What Does It Do? | Where Is It Used? |
|---|---|---|---|---|
DisplayType |
Display Type | Type1 |
Selects the type of digital display to use. | For selecting one of the two display types defined in the source code. |
DigitCount |
Digit Count | 4 |
Determines the number of digits used in the display. | For configuring how many digital digits are used to display the value. |
ElementWidth |
Element Width | 10 |
Determines the width of the segment elements. | For adjusting the visual dimensions of the segments. |
ItalicFactor |
Italic Factor | 0 |
Determines the slant or italicization factor of the digital elements. | For adjusting the geometric appearance of the segments. |
DisplayDecimal |
Display Decimal | true |
Determines whether decimal display is used. | For displaying decimal values digitally. |
ShowSign |
Show Sign | false |
Determines whether the sign of the numerical value is displayed. | For measurements where distinguishing positive and negative values is important. |
SegmentColorOff |
Segment Off Color | DimGray |
Determines the color of inactive segments. | For visually distinguishing between active and inactive segments. |
SegmentColorOn |
Segment On Color | Lime |
Determines the color of active segments. | For making the displayed digits stand out. |
OutlineColor |
Outline Color | Black |
Determines the outline color of the digital elements. | For making the boundaries of the segments more distinct. |
About DisplayType: The source code defines two
options: Type1 and Type2. Since the
provided source excerpt does not separately explain the drawing
differences between these two types, only the option names defined
in the source are used here.
| Technical Value | Description |
|---|---|
Type1 |
Type 1 |
Type2 |
Type 2 |
| Property | EOS Turkish Equivalent | Default | What Does It Do? | Where Is It Used? |
|---|---|---|---|---|
AutoScroll |
Automatic Scrolling | false |
Enables or disables the automatic scrolling behavior of the numerical display. | When automatic scrolling is required for presenting values in the display area. |
UseThreashold |
Use Threshold | false |
Determines whether threshold-based behavior is used. | On screens that require behavior based on exceeding a particular value or applying a threshold. |
ThreasholdValue |
Threshold Value | 0 |
Determines the reference value used when threshold functionality is enabled. | In applications where a value must be compared with a specified limit. |
Note: The technical spelling in the source code,
Threashold, has been preserved. Its EOS Turkish
equivalent is listed in the dictionary as Threshold
(Eşik).
When the UseFastGraph property is set to
true, a small Quick Graph icon appears in a lower corner
of the user control. When the operator moves the mouse pointer over
this icon, the historical trend graph for the data linked to the
control is displayed for the selected time interval. When the pointer
moves away from the icon, the graph disappears automatically.
The main advantage of this approach is that the operator can check not only the current numerical value but also its recent behavior without switching to a separate trend screen. This approach is consistent with the use of trend charts in industrial HMI systems to examine process data over time and view historical data. Rockwell Automation — Trend Chart and Siemens — Trend View.
Historical data for the selected time interval is displayed as a small preview chart.
FastGraphTimeInterval determines the historical time
interval displayed when Quick Graph is opened. The following options
are defined in the source code.
| Technical Value | Option | Historical Time Interval Displayed |
|---|---|---|
Last10minutes |
Last 10 Minutes | Last 10 minutes |
Last30minutes |
Last 30 Minutes | Last 30 minutes |
Last1hour |
Last 1 Hour | Last 1 hour |
Last3hours |
Last 3 Hours | Last 3 hours |
Last6hours |
Last 6 Hours | Last 6 hours |
Last12hours |
Last 12 Hours | Last 12 hours |
Last1day |
Last 1 Day | Last 1 day |
UseFastGraph = true, the Quick Graph icon appears in the lower corner.Monitor the motor's instantaneous speed on the segment display. If Quick Graph is enabled, quickly check changes over the last 10 or 30 minutes by hovering the mouse over the icon.
Display the tank level as a numerical value and allow the operator to examine recent rising or falling trends using Quick Graph.
Present the production count in a clear digital format. The digit count, sign, and segment colors can be configured according to the screen design.
Use a compact digital display so the operator can read the process value at a glance, with quick access to the historical trend when needed.
| Item | Corresponding SSD DISPLAY Setting |
|---|---|
| Control type | SSD_GOSTERGE |
| Default update interval | UpdateInterval = 1000 |
| Default digit count | DigitCount = 4 |
| Default active segment | SegmentColorOn = Lime |
| Default inactive segment | SegmentColorOff = DimGray |
| Default decimal display | DisplayDecimal = true |
| Default sign display | ShowSign = false |
| Default Quick Graph setting | UseFastGraph = false |
| Default Quick Graph interval | Last30minutes — Last 30 Minutes |
The SSD DISPLAY is an alternative numeric display user control that can be used to present current numerical process values on SCADA screens in a clear, segment-based digital format. Settings such as digit count, segment colors, decimal display, sign, automatic scrolling, and threshold allow it to be adapted to different display requirements.
One of the control's most notable features is Quick Graph: when the operator hovers over the icon in the lower corner, the historical trend for the selected time interval opens; when the pointer moves away, the graph closes automatically. This gives operators a quick way to switch between the current value and its recent historical trend.
Free Software Download Center
Software for industrial data collection, monitoring, and analysis.

Technical Support
Software documentation, sample code, and practical technical information.
You can contact us regarding EOS software, technical documentation, or industrial data communication.