
Free Software Download Center
Software for industrial data collection, monitoring, and analysis.
EOS SCADA • SVG_MACHINE • SVG GRAPHICS • DATA-RESPONSIVE SHAPES
SVG SHAPE ENGINE (SVG_MACHINE) is an advanced graphical user control approach designed to change the appearance of an SVG shape according to the state of its associated data on a SCADA screen, rather than displaying the data only as a numerical value.
The control's most powerful feature is its SVG State Collection structure. Properties such as threshold value, display color, outline color, fill color, blinking, and shape source can be defined separately for each state. This allows the same process variable to represent normal, warning, critical, or other operating conditions using different SVG graphics.

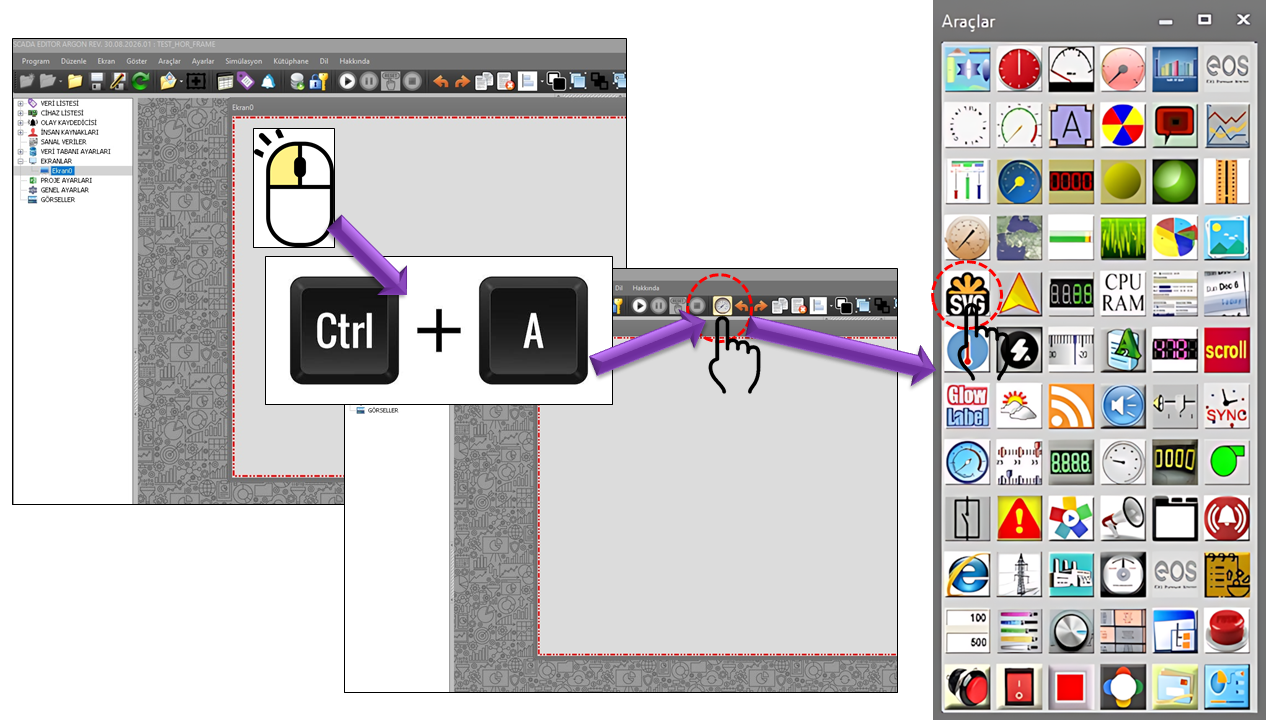
SVG_MACHINE (SVG SHAPE MACHINE) is an advanced user control that enables SVG-based vector shapes to be displayed on SCADA screens and dynamically changed according to the associated process data. The control is not limited to displaying a static SVG image; the visual properties of the shape can be transformed into different states depending on the values of the connected data.
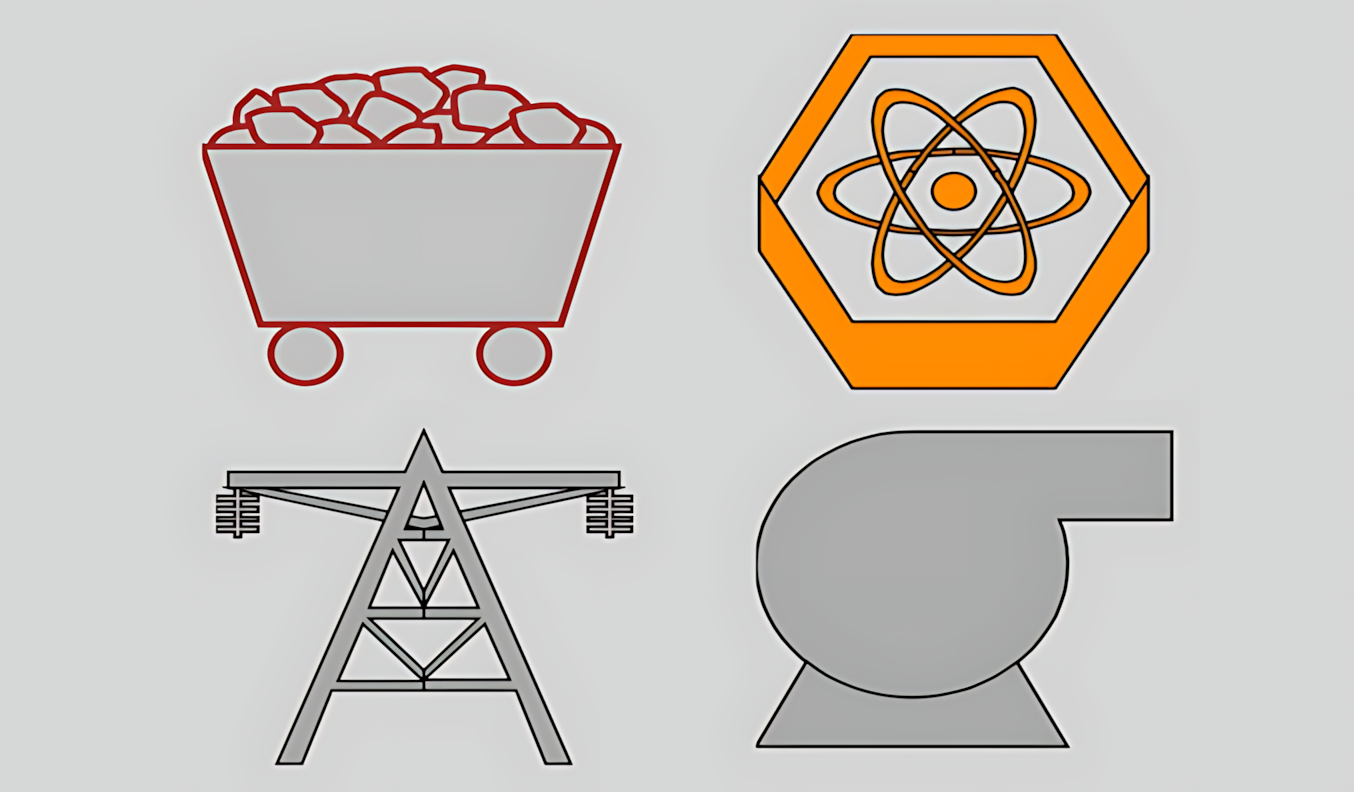
The key feature that distinguishes SVG_MACHINE from a conventional image viewer is that
the appearance can be configured according to the state of the connected SCADA data.
The SVG_STATE_COLLECTION class in the source code indicates that a separate SVG state can be defined for each data level and that different visual properties of the image can be configured together within that state.
Each SVG State Collection can define the visual behavior to be applied when the data reaches a specified threshold. Within this structure, properties such as the SVG image color, stroke color, fill color, shape to be used, visibility, and blinking can be changed according to the data state. Thus, the same user control can communicate the current process state to the operator not only through a numerical value but also through a direct graphical state change.
SVG_STATE_COLLECTION is one of the fundamental structures that connects SVG_MACHINE's data to its visual representation. Users can define different SVG states for different value ranges of the connected SCADA data.
This structure allows SVG_MACHINE to be used as graphical symbols that convey status information for industrial objects such as valves, pumps, motors, fans, tanks, circuit breakers, switches, generators, process equipment, and similar components. For example, the same pump symbol can be displayed in one color under normal conditions, change to another SVG shape when a specified data threshold is reached, or be configured to blink in a critical state.
Changes to color, shape, visibility, or blinking on SVG_MACHINE provide a graphical representation of the SCADA data connected to the user control. Therefore, the thresholds and visual meanings used to define SVG states must be configured to match the actual operating states of the relevant process variable.
One data source → multiple SVG states. The connected data is evaluated against defined thresholds. The image, color, stroke, fill, visibility, or blinking behavior defined for the matching SVG state is then applied. This transforms the graphic from merely “an image” into a dynamic representation of the process state.
SVG (Scalable Vector Graphics) is an XML-based markup language used to describe two-dimensional vector graphics. The W3C SVG standard defines SVG as a language for describing two-dimensional vector and mixed vector/raster graphics. SVG content is scalable and can be displayed at different resolutions.
An important distinction of SVG is that an image is not stored solely as a pixel matrix. Instead, graphic components such as lines, shapes, paths, colors, and filters can be defined using an XML-based structure. According to MDN, SVG can be styled with CSS, made interactive with JavaScript, and created using graphic elements such as circle, rect, path, and polygon.
| Property | Meaning in SVG | Importance for SVG_MACHINE |
|---|---|---|
| Vector structure | Graphics are defined using shapes and paths. | Shapes can retain their sharpness at different control sizes. |
| XML-based structure | The graphic definition is textual and structured. | It is a suitable source format for using external SVG files. |
| Scalability | SVG can be displayed at different sizes. | It can be adapted to different resolutions and control sizes in SCADA screen designs. |
| Style and appearance | Colors, strokes, fills, and various graphic properties can be defined. | It provides a foundation for creating visual states according to connected data through the SVG State Collection. |
An industrial symbol can represent a valve, pump, fan, tank, motor, circuit breaker, or another process component. With SVG_MACHINE, the color of the same symbol can change according to the data level, another SVG shape can be used, the fill or stroke can change, or blinking can be enabled to draw attention to a particular state.
In the SVG_MACHINE approach, the shape source is not limited to the application's built-in images. Users can select an SVG image from the library or use an external SVG file for the control. The _ImageFileName and _LibrarySelectedImage fields in the source code clearly distinguish these two approaches to selecting a shape source.
The selection approach associated with LibrarySelectedImage allows an SVG image to be selected from the control's built-in shape library. This method is suitable for using frequently repeated standard process symbols consistently across project screens.
ImageFileName is defined in the source code as the field that stores the name of an external image file. This allows users to use an SVG image they have created themselves or obtained from a suitable source as the control's shape.
In addition to ensuring that the SVG file renders correctly, it is important to ensure that the file is accessible in the project environment. During project deployment, the file path, file accessibility, and SVG content obtained from an external source must be verified on the target system. Since SVG is an XML-based graphic format containing commands and elements, files obtained externally should be selected from trustworthy sources.
SVG_STATE_COLLECTION is a data structure that defines how an SVG shape should be displayed when the connected SCADA data reaches a particular value range or state. According to the source code provided by the user, each collection item contains fields such as image color, stroke color, fill color, data threshold, blinking, image file, library selection, and visibility.
| Source Field | EOS Turkish Equivalent | Default | Role |
|---|---|---|---|
_LevelImageColor |
Level Image Color | Black |
Defines the color associated with the image at the relevant data level. |
_LevelStrokeColor |
Level Stroke Color | Silver |
Determines the stroke color of the SVG shape. |
_LevelFillColor |
Level Fill Color | Silver |
Determines the fill color of the SVG shape. |
_LevelThreshold |
Level Threshold | 10 |
Represents the data threshold used to activate this SVG state. |
_BlinkActive |
Blinking Active | false |
Determines whether blinking is enabled at the relevant data level. |
_ImageFileName |
Image File Name | "" |
Stores the name of the external image file to be used for the state. |
_LibrarySelectedImage |
Library Selected Image | "" |
Represents the SVG image selected from the library for the state. |
_LibraryImage |
Library Image | null |
Stores the object representation of the image selected from the library. |
_Visible |
Visible | true |
Determines whether the visual for the relevant state is visible. |
Because the state does not have to change only the color. Within the same threshold logic, the stroke, fill, blinking, visibility, and even the SVG shape being used can be changed. This allows the operator to distinguish the process state graphically at a glance.
The source code contains two alarm types in an enumeration named ILAlarmTuru. Their names represent two different approaches to visually indicating an alarm.
This option is intended to represent an alarm or state change visually through color. Its basic use is to vary visual properties such as color, stroke, or fill according to the data state while keeping the SVG shape unchanged.
This option is intended to represent an alarm or state change by directly replacing the SVG shape being used. This allows different SVG symbols to represent normal, warning, or other operating states of the same process component.
Color change and shape change are not the same thing. With the Colored approach, the operator observes changes in the appearance of the existing symbol; with the Shapechange approach, the symbol itself can change. Therefore, the visual meaning of alarm states must be clearly defined in operator training and screen design.
The LevelThreshold field defines the data threshold for an SVG State Collection item. The default value for a single collection item is specified as 10 in the source code. The example below illustrates how the control can be configured with multiple state items; the values are illustrative and do not represent a fixed alarm range defined in the source code.
For example, a circular symbol could be used for a low process value, a different fill color when a threshold is exceeded, blinking at a higher level, and a triangular alarm symbol in a critical state. The key point is that each data range can be defined by its own SVG State Collection item, allowing the shape to change in ways that go beyond a simple color change.
The GNAciBilgisi enumeration defines four basic rotation angles for an SVG shape. These options represent fixed rotation positions that can be used especially for directional symbols, such as valves, motors, arrows, fans, flow directions, and similar directional graphics.
ZerodegreesNinthydegreesHundredEightydegreesTwohundredseventhydegreesThe following table summarizes the SVG_STATE_COLLECTION fields directly visible in the source code excerpt provided by the user and their corresponding EOS Turkish terminology. Default values not present in the source excerpt have deliberately not been invented.
| Technical Field | EOS Turkish Equivalent | Default | Description |
|---|---|---|---|
_LevelImageColor |
Level Image Color | Black |
The image color for the state level. |
_LevelStrokeColor |
Level Stroke Color | Silver |
The color of the SVG stroke at the state level. |
_LevelFillColor |
Level Fill Color | Silver |
The color of the SVG fill at the state level. |
_LevelThreshold |
Level Threshold | 10 |
Represents the data threshold for the state. |
_BlinkActive |
Blinking Active | false |
Determines whether blinking is enabled at this level. |
_ImageFileName |
Image File Name | "" |
Stores the file name for an externally sourced SVG image. |
_LibrarySelectedImage |
Library Selected Image | "" |
Represents the SVG image selected from the library. |
_LibraryImage |
Library Image | null |
Represents the selected library image as an object. |
_Visible |
Visible | true |
Determines the visibility of the SVG state. |
The options defined in the source code make it possible to configure SVG_MACHINE's behavior more precisely than using fixed text values.
| Enumeration | Technical Option | Turkish Equivalent | Usage |
|---|---|---|---|
ILAlarmTuru |
Colored |
Colored | Expresses alarm/state visualization through color. |
ILAlarmTuru |
Shapechange |
Shape Change | Expresses alarm/state visualization by changing the SVG shape. |
GNAciBilgisi |
Zerodegrees |
0 Degrees | Basic orientation. |
GNAciBilgisi |
Ninthydegrees |
90 Degrees | Quarter-turn rotation. |
GNAciBilgisi |
HundredEightydegrees |
180 Degrees | Half-turn rotation. |
GNAciBilgisi |
Twohundredseventhydegrees |
270 Degrees | Three-quarter-turn rotation. |
Can be used to display the operating state of motors, fans, pumps, and similar equipment using different SVG symbols and colors.
Suitable for displaying fills, colors, strokes, or different process symbols according to level data.
Can visualize circuit breakers, disconnectors, power flow, or equipment states through symbol changes and color coding.
Visual notifications can be created through color changes, blinking, or switching to a different alarm SVG when a measurement threshold is exceeded.
Keeping the meanings of colors and shapes consistent throughout a project helps operators recognize states quickly. For example, if the “running,” “standby,” “fault,” and “communication lost” states of a component are represented by different SVG symbols, the meaning of each symbol should remain the same across all screens.
Since SVG_MACHINE is a visualization control, it is particularly important to test state thresholds together with their corresponding visual representations. In the source excerpt provided by the user, the threshold and appearance fields within SVG_STATE_COLLECTION are stored directly in the same state definition.
LevelThreshold value matches the expected data range.BlinkActive is enabled.Visible occur in the expected state.ILAlarmTuru selection matches the Colored or Shapechange behavior.GNAciBilgisi.This page directly explains the fields explicitly provided in the source code. Other general user-control properties of SVG_MACHINE and details of its data connection have not been assumed because they are not present in the supplied source excerpt.
| Topic | Core Structure | Summary |
|---|---|---|
| Control | SVG_MACHINE |
A user control approach that visualizes SCADA data using dynamic SVG graphics. |
| State Structure | SVG_STATE_COLLECTION |
Allows SVG properties to be defined separately according to data thresholds. |
| Shape Source | ImageFileName / LibrarySelectedImage |
An external SVG file or a library image can be used. |
| Alarm | ILAlarmTuru |
Colored or Shapechange. |
| Visual State | LevelImageColor / LevelStrokeColor / LevelFillColor |
Image, stroke, and fill colors can be defined for each state. |
| Blinking | BlinkActive |
Blinking can be enabled for the relevant state. |
| Visibility | Visible |
The visibility of the state image can be controlled. |
| Rotation | GNAciBilgisi |
Options for 0°, 90°, 180°, and 270°. |
Conclusion: The distinguishing feature of SVG SHAPE MACHINE is that it does not merely display an SVG as an image; it transforms connected SCADA data into a shape state. Through the SVG State Collection, the same process component can be represented by different colors, strokes, fills, visibility settings, blinking behavior, or even a different SVG shape as the data changes.
img, object, iframe, or direct embedding in HTML. MDN — Including vector graphics in HTML
Free Software Download Center
Software for industrial data collection, monitoring, and analysis.

Technical Support
Software documentation, sample code, and practical technical information.
You can contact us regarding EOS software, technical documentation, or industrial data communication.