SCADA Systems
Continuously monitors whether the SCADA computer is reachable and whether the SCADA software is running actively.
MONITOR THE HEALTH OF YOUR INDUSTRIAL SYSTEMS IN REAL TIME
EOS SCADA HEALTH MONITOR is an independent system monitoring software developed to continuously monitor the health of SCADA and EVENT RECORDER systems, local controllers, controller computers, and compatible network devices in real time.
Monitor from a single dashboard whether a device is powered on, whether the associated software is running, and which software is active, in hot-standby mode, or shut down in redundant systems. Receive immediate visual and audible alerts whenever a status changes.

HEALTH MONITOR independently monitors the operating status of SCADA and event recording systems. It continuously evaluates the connectivity, database, and redundancy status of monitored devices and provides operators with a clear system health overview.
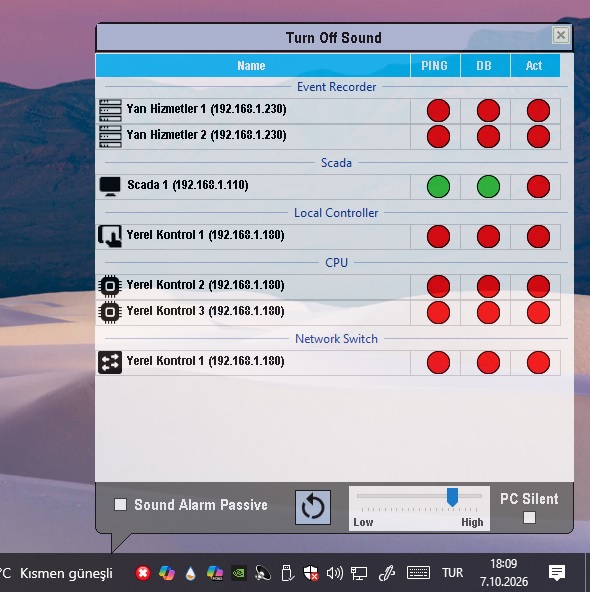
During normal operation, the program continues running as an icon in the system tray at the bottom of the screen. Users can open the health monitoring screen by clicking this icon whenever needed.
Continuously monitors whether the SCADA computer is reachable and whether the SCADA software is running actively.
Monitors the connectivity and operating status of Event Recorder systems to track the health of the event recording infrastructure.
Monitors the real-time accessibility of local controllers and controller computers.
Allows the health and accessibility of designated controller computers to be monitored.
You can include compatible network devices in the monitoring system to track their accessibility.
Tracks which data acquisition or SCADA software instance is active, in hot-standby mode, or shut down in redundant configurations.
HEALTH MONITOR presents complex system statuses through LED indicators, enabling operators to assess conditions quickly. For each device, PING, DB, and REDUNDANCY ACTIVE STATUS can be monitored in particular.
Indicates that the corresponding status is normal and healthy.
Used to distinguish normal but inactive states, such as hot standby, in redundant systems.
Indicates a problem with connectivity or operation and alerts the operator that attention is required.
HEALTH MONITOR is more than just a status display. Whenever the health status of any monitored system changes, the screen opens automatically and an audible alert is issued.
The user can mute the alarm and close the health monitoring screen to minimize the program back to its system tray icon.
The system checks whether the device is reachable through its configured IP address.
If the device is reachable, the operating status of the SCADA, Event Recorder, or relevant system software is monitored.
The accessibility of the configured EOS_STATUS.FDB database and the relevant system statuses are monitored.
In redundant systems, active, hot-standby, and shut-down states are distinguished from one another.
The results are presented to the operator using green, orange, and red LED indicators.
When the health status changes, the screen opens and the user is notified by an audible alert.
All devices to be monitored by HEALTH MONITOR must be defined in a text input file. Each line represents one system or device to be monitored.
scada|192.168.1.110|Scada 1|C:\DataLogger\FDB\EOSDB_STATUS.FDB

             ev|192.168.1.230|Ancillary Services 1|C:\DataLogger\FDB\EOSDB_STATUS.FDB

             ev|192.168.1.230|Ancillary Services 2|C:\DataLogger\FDB\EOSDB_STATUS.FDB

             local|192.168.1.180|Local Controller 1|C:\DataLogger\FDB\EOSDB_STATUS.FDB

             cpu|192.168.1.180|Local Controller 2|C:\DataLogger\FDB\EOSDB_STATUS.FDB

             cpu|192.168.1.180|Local Controller 3|C:\DataLogger\FDB\EOSDB_STATUS.FDB

             switch|192.168.1.180|Local Controller 1|C:\DataLogger\FDB\EOSDB_STATUS.FDB
| Field | Description |
|---|---|
| Field 1 | Type of monitored system: scada, ev, local, cpu, or switch |
| Field 2 | The device's IP address |
| Field 3 | The device / system name displayed in the program |
| Field 4 | The location of the EOS_STATUS.FDB database |
Used to monitor SCADA computers and SCADA software status.
Used to monitor Event Recorder systems.
Used to define local controller systems.
Used for CPU-level / device-level monitoring of controller computers.
Used to include compatible smart network devices in the monitoring system.
For the program to function properly, network access to the devices being monitored, the required databases, and the relevant services/ports must be enabled.
In particular, if the monitored system is located on another computer, firewall rules and network and port permissions between the computer running HEALTH MONITOR and the target computer must be checked.
An accessible IP address alone may not be sufficient. The required network and port permissions must also be in place to access the databases and system status information needed by the program.
Therefore, before deploying HEALTH MONITOR, the system administrator should verify IP connectivity, firewall rules, database access, and the required port permissions for the relevant devices.
HEALTH MONITOR operates independently of the SCADA and Event Recorder software it monitors. This allows operational problems affecting the monitored software or its computer to be detected by a separate monitoring layer.
It is recommended to add the program to the computer's startup sequence, if possible, so that it runs automatically whenever the system starts.
As soon as the program starts, it appears as an icon in the system tray and remains there during normal operation.
The program is not intended to be closed under normal conditions; it is designed to continuously perform system health monitoring.
Is your SCADA screen running? Is Event Recorder operating? Is the redundant system really in hot-standby mode? Is the local controller reachable? Is your network device responding?
EOS SCADA HEALTH MONITOR continuously monitors the answers to these questions and promptly notifies operators of changes in the system. This allows you to monitor the health of critical systems from a single location and respond to potential problems more quickly.
Use HEALTH MONITOR 2024 for systems running on the Firebird 2.5 database platform.
Use HEALTH MONITOR 2026 for systems running on the Firebird 5.0 database platform.

Free Software Download Center
Software for industrial data collection, monitoring, and analysis.

Technical Support
Software documentation, sample code, and practical technical information.
You can contact us regarding EOS software, technical documentation, or industrial data communication.