
Free Software Download Center
Software for industrial data collection, monitoring, and analysis.
DIAGNOSTICS • DIAG • EOS CPU • ALGORITHM • DIAGNOSTICS • CONTROLLER
Within EOS SCADA Runtime, control algorithms created with the Engineering Software can be viewed, users can navigate between algorithm pages, and users with the required permissions can send commands to the controller.
The DIAGNOSTICS tool is used for these operations. The DIAGNOSTICS feature enables algorithms running on the controller in the SCADA Runtime environment to be inspected and used for diagnostic purposes.

The DIAGNOSTICS tool allows control algorithms created with the Engineering Software to be viewed and inspected in the RUNTIME environment.
On the DIAG screen, the user can navigate between algorithm pages and perform the operations that can be performed with the Engineering Software, except for modifying the algorithm.
If the user has sufficient permissions, commands can also be sent to the EOS CPU (Controller) through the DIAG screen.
Information: The DIAGNOSTICS feature is primarily used to view, inspect, and diagnose control algorithms running in the Runtime environment.
To use the DIAGNOSTICS feature, the required DIAGNOSTICS software and libraries must be placed in the EOSDIAG folder located under the RUNTIME program folder.
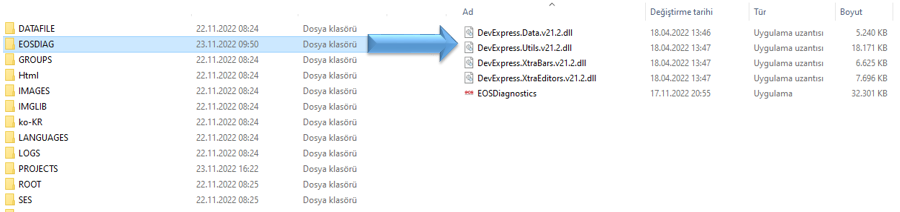
Preparation:
Extract the DIAGNOSTICS software and libraries obtained from the EOS Group into the EOSDIAG folder under the RUNTIME program folder.
If the required tools are already available in the specified location, this step can be skipped and you can proceed to the next step.
To use the DIAGNOSTICS feature, the project settings of the relevant project must first be configured in EOS SCADA Editor.
| Project Setting | Function |
|---|---|
| Diagnostics | Enables or disables the use of the DIAGNOSTICS feature. |
| Check Diagnostic Data | When RUNTIME starts, checks whether the algorithm information in the project folder is up to date with the information on the EOS CPU. |
Setting the Diagnostics option to True in Project Settings activates the DIAGNOSTICS feature.
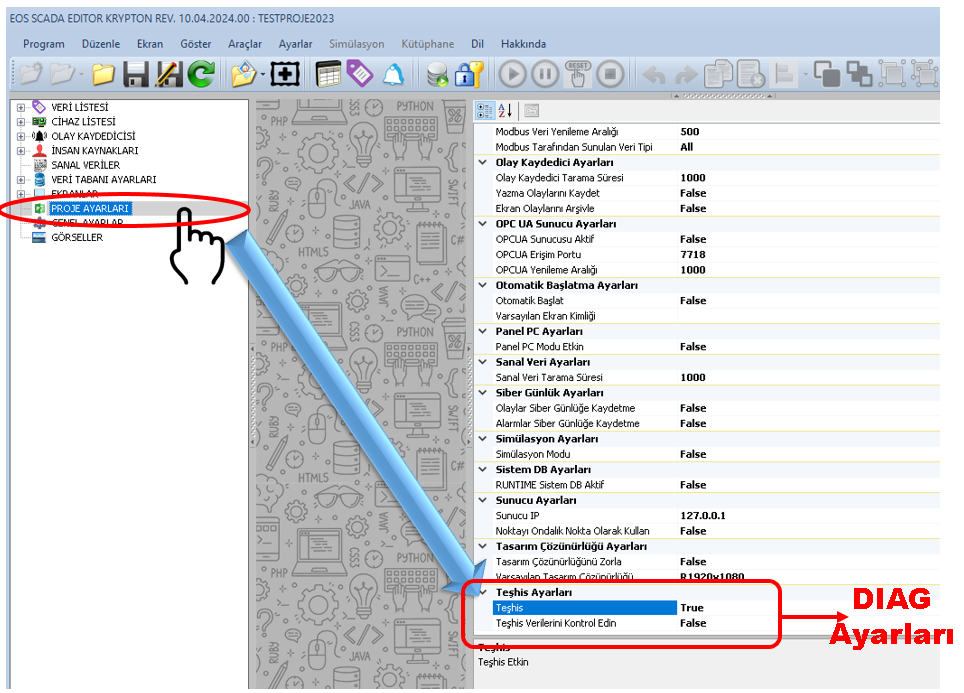
When this option is enabled, the DIAG feature can be used within RUNTIME.
Result: When Diagnostics = True, the DIAGNOSTICS feature becomes available.
When the Diagnostics option is set to True, RUNTIME checks the status of the algorithm information in the project folder every time it starts.
If the algorithm information is not available in the project folder, the required information is downloaded from the EOS CPUs (Controllers).
If the algorithm information is available in the project folder, RUNTIME checks whether the algorithms on the EOS CPUs are up to date. If the information is found to be outdated, the latest algorithm information is downloaded from the EOS CPUs.
Automatic update logic:
When algorithms are changed frequently, especially during development stages, it is recommended to set the Check Diagnostic Data option to True.
In this case, when RUNTIME starts, it checks whether the DIAGNOSTICS information in the project folder is up to date with the information on the EOS CPU.
CAUTION: When algorithms are changed frequently, particularly during development, setting Check Diagnostic Data to True may slow down the RUNTIME startup process.
When the Check Diagnostic Data option is set to False, the update status of the algorithm information is not checked automatically.
In this case, the DIAGNOSTICS information must be manually downloaded from the EOS CPUs by the user.
In the RUNTIME software, the DIAGNOSTICS information can be retrieved from the CPU by clicking the UPDATE DIAGNOSTIC DATA button under the EDIT menu.
Manual update:
CAUTION: When Check Diagnostic Data is set to False, all algorithm updates must be performed manually using the method described above.
When the Diagnostics option is set to True, the user can access the DIAG feature from RUNTIME.
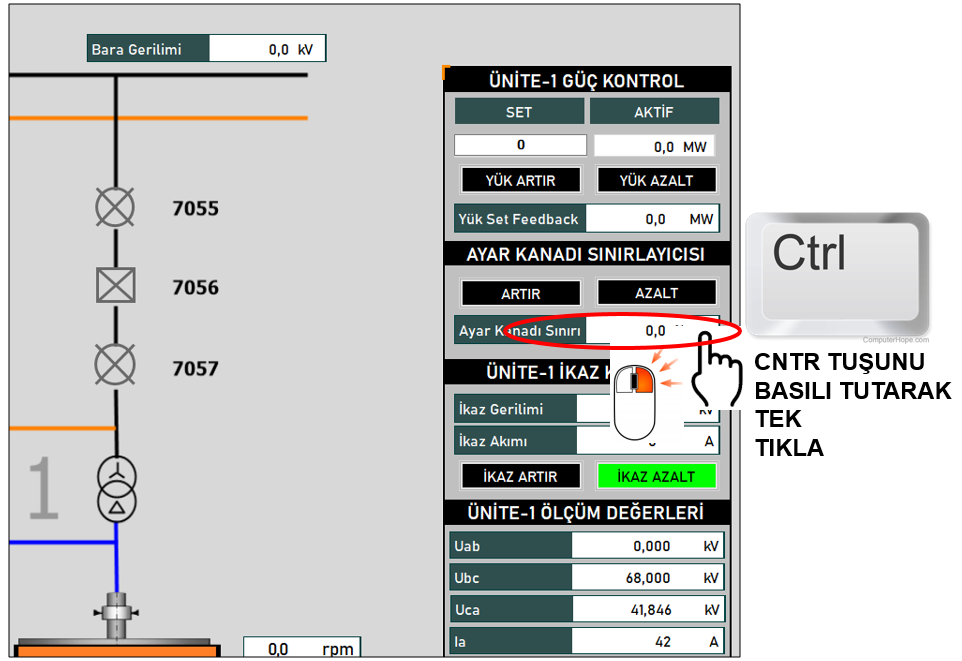
To do this, simply use the CTRL + Right Mouse Button combination on a user control located on any SCADA page.
To open the DIAG screen:
When CTRL + Right Mouse Button is performed on the user control, a screen indicating that the EOS DIAGNOSTICS screen is being opened is displayed.
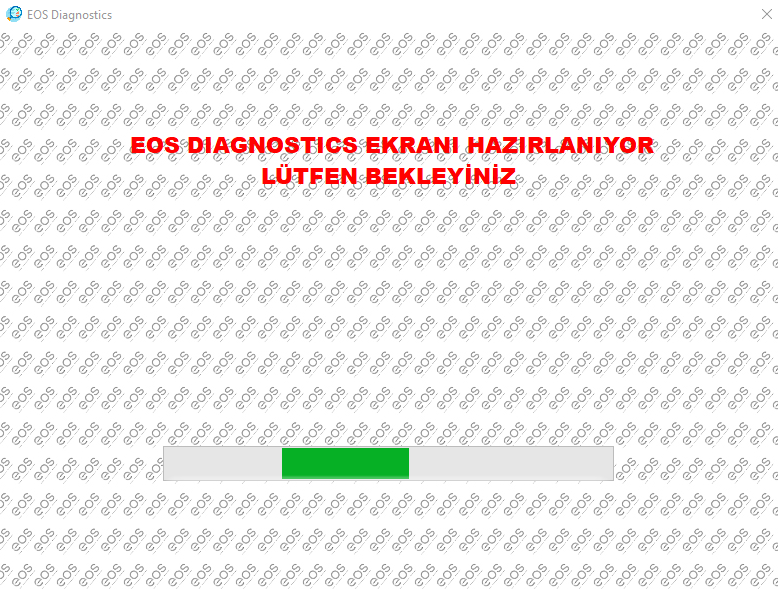
At this stage, the operations required to prepare the DIAG tool are performed.
When preparation is complete, the DIAG algorithm page associated with the data (TAG) linked to the selected user control is displayed.
Result: The TAG associated with the user control is opened in the DIAG screen, with the relevant algorithm page selected.
After the DIAG screen is opened, the user can navigate between algorithms.
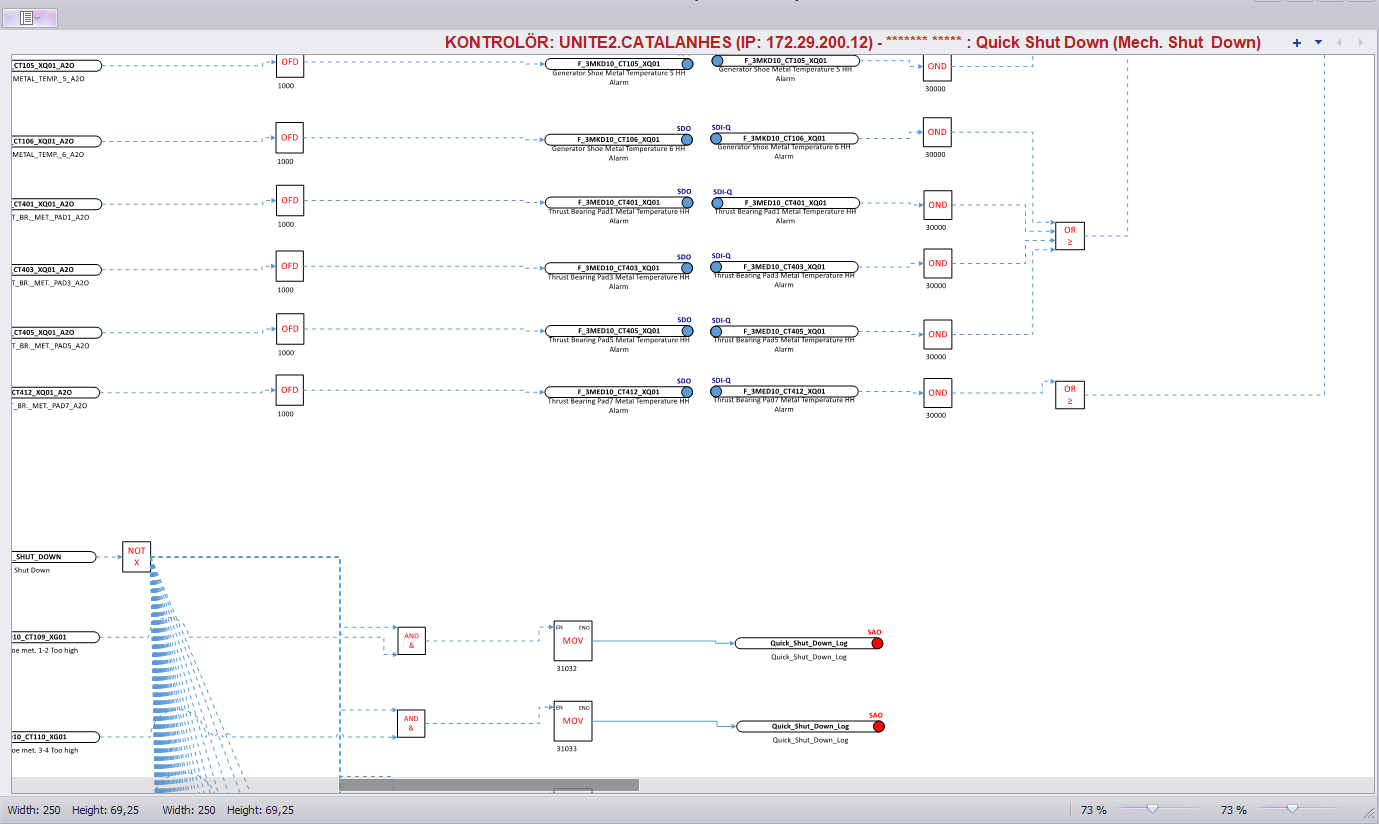
Operations that can be performed with the Engineering Software can also be performed through the DIAG screen, except for modifying the algorithm.
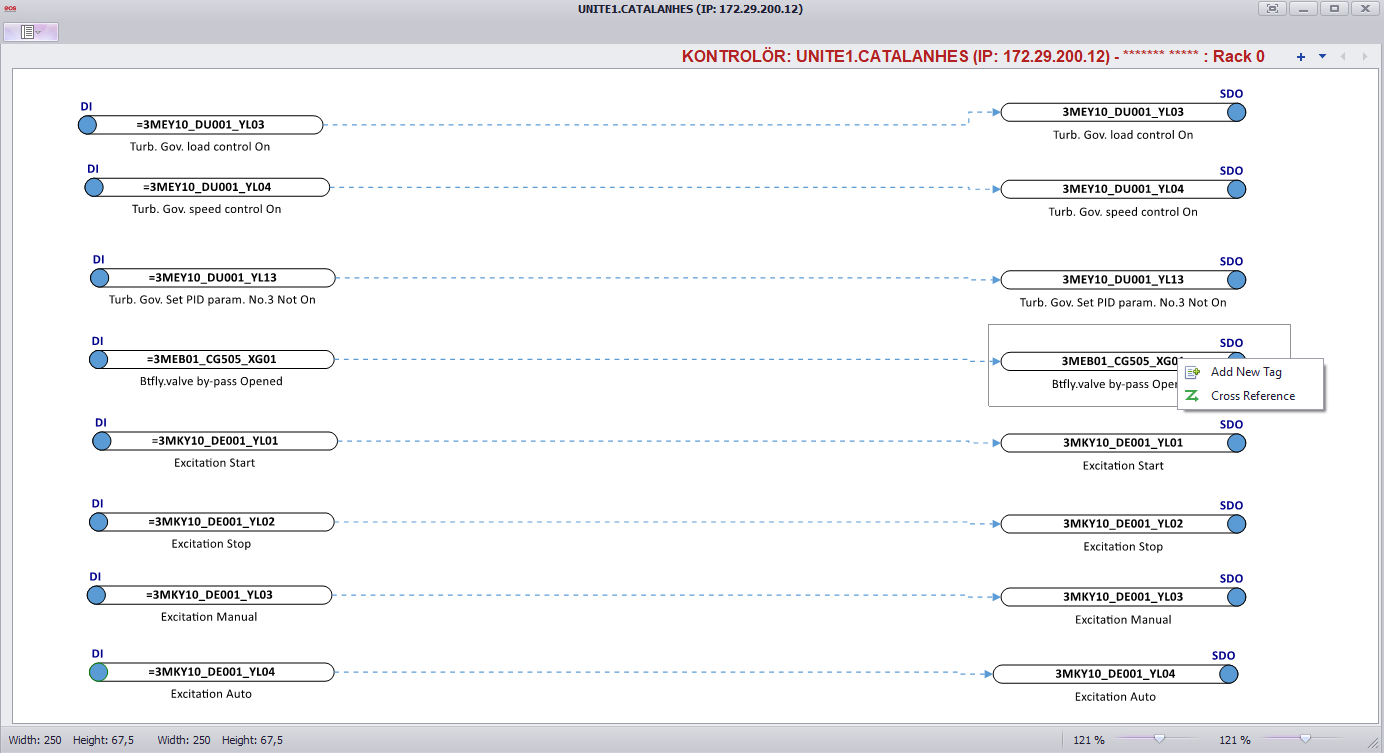
If the user has the required permissions, it is also possible to send commands to the EOS CPU (Controller).
| DIAG Function | Description |
|---|---|
| Algorithm Viewing | Viewing algorithm information available on the controller. |
| Navigating Between Algorithms | Navigating between different algorithm pages. |
| Diagnostics | Inspecting the operating status of control algorithms. |
| Command Sending | Sending commands to the CPU by users with sufficient permissions. |
If the user wants to open the DIAG screen for a different data (TAG), the currently open DIAG screen must first be closed.
CAUTION: To open the DIAG screen for a different data (TAG), the user must first close the currently open DIAG screen.
After closing the DIAG screen, the DIAG screen for the new TAG can be opened by performing CTRL + Right Mouse Button on a different user control on the relevant SCADA page.
| Setting | Behavior | Usage |
|---|---|---|
| Diagnostics = True | The DIAGNOSTICS feature is enabled. | The DIAG feature can be used from within Runtime. |
| Diagnostics = False | The DIAGNOSTICS feature cannot be used. | The DIAG feature is unavailable. |
| Check Diagnostic Data = True | The update status of algorithm information is checked when RUNTIME starts. | Particularly useful during development stages when algorithms are frequently changed. |
| Check Diagnostic Data = False | The update status of algorithm information is not checked automatically. | The UPDATE DIAGNOSTIC DATA operation must be performed manually. |
The DIAGNOSTICS tool is an important auxiliary tool used to view and inspect control algorithms created with the Engineering Software in the EOS SCADA Runtime environment.
With the DIAGNOSTICS feature activated by setting Diagnostics to True, the user can directly access the DIAG algorithm page associated with the relevant TAG through a user control on the SCADA screen.
On the DIAG screen, users can navigate between algorithms and perform operations available through the Engineering Software, except for modifying the algorithm. Users with sufficient permissions can also send commands to the EOS CPU.
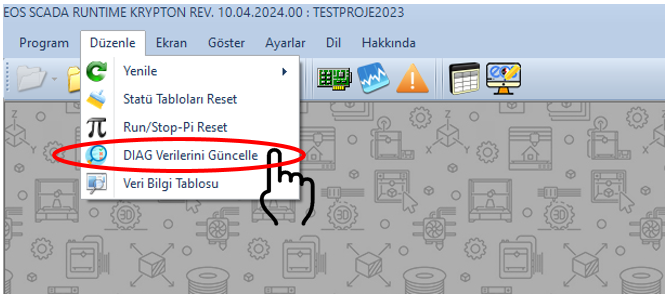
When Check Diagnostic Data is set to True, the update status of algorithm information is checked when RUNTIME starts. When this option is False, the DIAG information must be updated manually using the EDIT → UPDATE DIAGNOSTIC DATA command.
Especially during development, automatic checking provides convenience when algorithms are frequently changed; however, it should be taken into consideration that this operation may increase the RUNTIME startup time.
Free Software Download Center
Software for industrial data collection, monitoring, and analysis.

Technical Support
Software documentation, sample code, and practical technical information.
You can contact us regarding EOS software, technical documentation, or industrial data communication.