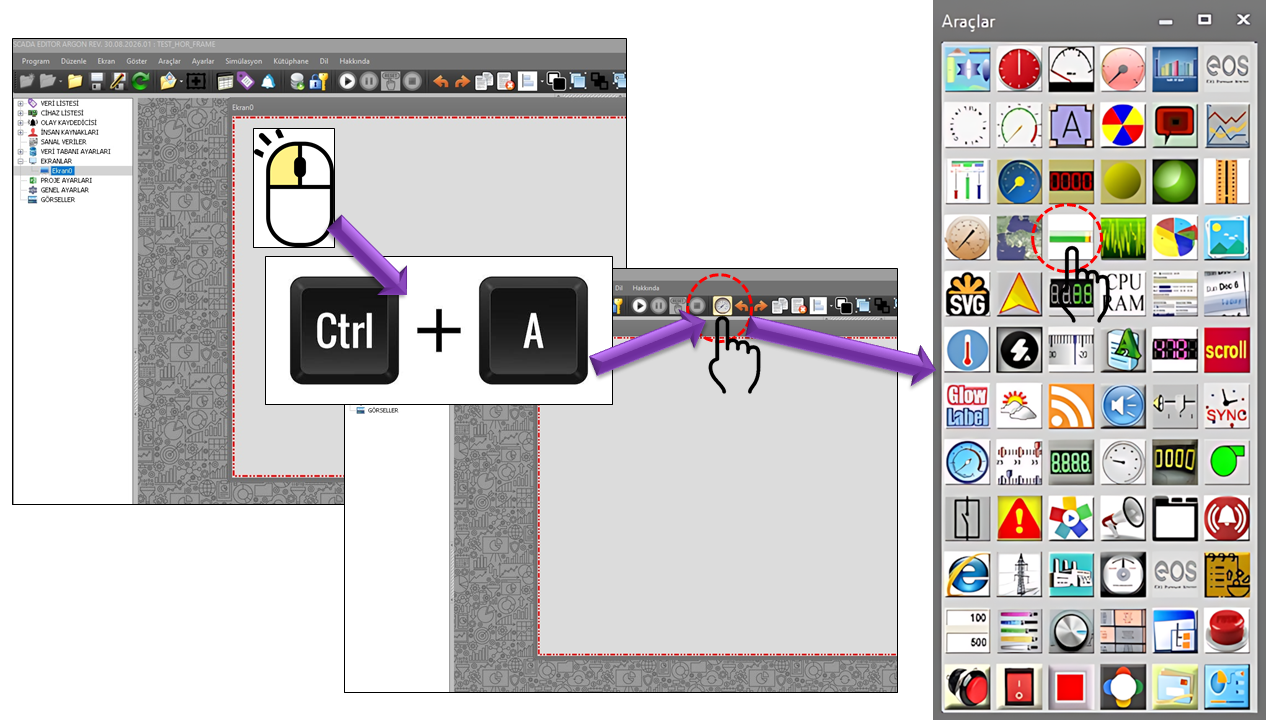
BULLET_GRAPH is a compact user control that displays an SCADA
data value as a bar extending horizontally or in the reverse
direction on EOS SCADA screens. It provides an at-a-glance view of the value
in context by using a comparative SCADA value and optional Color Ranges
on the same chart scale.
In the control's primary data flow, the SCADA data read through ReadData
forms the main bar on the chart. ComparativeMeasureData provides the
SCADA data used for comparison. This allows operators to assess not only the current
value but also its relationship to another measurement, target, or performance
reference on a single indicator.

BULLET_GRAPH helps SCADA operators quickly interpret a process value within a defined
graphical range and in relation to comparison information, rather than viewing the
value in isolation. The central visual element is the read SCADA data value
rendered as a bar.
In the source code, _ReadData is defined as the SCADA data value that is
read and drawn as a BAR, while _ComparativeMeasureData is defined as the
SCADA data value used for comparison. These two data sources directly correspond to
the classic BULLET_GRAPH approach of “current value + comparison.”
The Color Regions defined by _ColorRegions can be used
to divide the chart range into qualitative performance zones. However, the supplied
source code does not specify the drawing order of these regions or the algorithm
applied when RegionMax values overlap. Therefore, this page describes
only the structure supported by the source code.
Basic Operating Principle
Read SCADA Value → BAR
Comparative SCADA Value → Benchmark/comparison
Chart Range → Visual scale
Color Regions → Performance context
This structure is suitable for SCADA screens where answering “Where is the
value relative to the reference?” is more important than simply answering
“Where is the value?”
When configuring BULLET_GRAPH, first define the data sources, then specify the
chart orientation and range, the appearance of the main bar, the comparative
measurement, the text settings, and finally the color regions.
Recommended Configuration Sequence
- Data: Use
ReadData to specify the SCADA data value to be displayed as a bar.
- Comparison: Use
ComparativeMeasureData to specify the SCADA data value for comparison.
- Chart: Define the
FlowDirection and GraphRange values.
- Featured measurement: Configure the bar color and display setting.
- Comparative measurement: Configure the comparison indicator's color, constant, and text.
- Color regions: Define the performance zones using
REGION_COLLECTION items.
Source Code Limitation
In the supplied source code, only the RegionColor and
RegionMax fields of the REGION_COLLECTION class
are shown. Therefore, this page does not assume any behavior that is not
documented in the source code regarding how the lower bounds of color regions
are calculated, how the collection is sorted, or how overlapping ranges are handled.
General properties define the control's basic operating behavior and its text
and appearance settings on the SCADA screen.
| Property |
EOS Turkish Equivalent |
Default |
Purpose |
Typical Application |
UCType |
Control Type |
BULLET_GRAPH |
Defines the type of user control within EOS SCADA. |
All SCADA screens where the BULLET_GRAPH control is defined. |
UpdateInterval |
Update Interval |
1000 ms |
Specifies the interval at which the control refreshes its current data. |
Screens where live process data is refreshed periodically. |
DecimalPoint |
Decimal Places |
0 |
Specifies the number of decimal places used to display numerical values. |
Numerical process values such as power, flow rate, level, and pressure. |
UCBackColor |
Control Background Color |
Transparent |
Specifies the control's background color. |
Integrating the control into the overall SCADA screen design. |
UCForeColor |
Control Text Color |
Black |
Specifies the control's primary text color. |
Maintaining visual consistency for text displayed on the chart. |
UCFont |
Control Font |
Arial Narrow, 8.25 pt |
Specifies the control's font. |
Adjusting the readability of scale labels and control text. |
A key feature that distinguishes BULLET_GRAPH from many other chart controls is
that the main bar and the comparative measurement are handled as separate data
sources. In the source code, both fields are defined as string.
| Property |
EOS Turkish Equivalent |
Default |
Purpose |
Typical Application |
ReadData |
Read Data |
string |
Represents the SCADA data value that is read and drawn as a BAR on the chart. |
Displaying an instantaneous process value as the main indicator bar. |
ComparativeMeasureData |
Comparative Measurement Data |
string |
Represents the SCADA data value used for comparison. |
Comparing the current value with a target, reference, or another SCADA measurement. |
SCADA Example
In a hydroelectric power plant, ReadData could be linked to the
generator's instantaneous active power, while ComparativeMeasureData
could be linked to the target active power of the same unit. For example, if
the chart range is 100 MW, the bar could display a value of 72 MW while the
comparison indicator marks the 80 MW target. This allows the operator to see
the current power and its position relative to the target at a glance.
| Property |
EOS Turkish Equivalent |
Default |
Purpose |
Typical Application |
FlowDirection |
Flow Direction |
Lefttoright |
Specifies the direction in which the bar progresses across the chart range. |
Standard left-to-right displays or custom right-to-left screen designs. |
GraphRange |
Chart Range |
100 |
Specifies the chart's basic value range. |
Scaling percentages, power, flow rate, level, or other numerical measurements. |
| Option |
English |
Description |
Lefttoright |
Left to Right |
Causes the bar to progress from left to right across the chart range. |
Righttoleft |
Right to Left |
Causes the bar to progress from right to left across the chart range. |
Featured Measurement Settings
This group contains settings for visually highlighting BULLET_GRAPH's main
measurement. The naming used in the source code indicates that the primary
measurement is treated as the Featured Measure.
| Property |
EOS Turkish Equivalent |
Default |
Purpose |
Typical Application |
FeaturedMeasureColor |
Featured Measure Color |
DarkOrange |
Specifies the visual color of the featured main measurement. |
Highlighting the read SCADA value on the bar. |
DisplayFeaturedMeasure |
Display Featured Measure |
false |
Specifies whether the featured measurement is displayed visually. |
Screens where the visibility of the main bar is controlled. |
FeaturedStartString |
Featured Start String |
"" |
Specifies the text to be used at the beginning of the featured measurement. |
Screens designed to display explanatory text or units around the chart. |
FeaturedEndString |
Featured End String |
"" |
Specifies the text to be used at the end of the featured measurement. |
When additional information or a unit needs to be appended to the value. |
Comparative Measurement Settings
The comparative measurement helps BULLET_GRAPH relate a target or reference value
to the main bar on the same scale. In the source code, both a SCADA data source
and a constant field are defined for the comparative measurement.
| Property |
EOS Turkish Equivalent |
Default |
Purpose |
Typical Application |
ComparativeMeasureColor |
Comparative Measurement Color |
Maroon |
Specifies the visual color of the comparative measurement. |
Distinguishing a target or reference value from the main bar. |
DisplayComparativeMeasure |
Display Comparative Measure |
false |
Specifies whether the comparative measurement is displayed. |
Situations where target/reference information needs to be visible on screen. |
ComparativeMeasureConstant |
Comparative Measurement Constant |
"" |
Represents a constant value that can be defined for the comparative measurement. |
Designs that use the constant comparison option defined in the source code. |
ComparativeMeasureStartString |
Comparative Measure Start String |
"" |
The start text for the comparative measurement, as defined in the source code. |
Formatting text at the beginning of the comparison display. |
ComparativeMeasureEndString |
Comparative Measure End String |
"" |
The end text for the comparative measurement, as defined in the source code. |
Formatting text at the end of the comparison display. |
Terminology Note
In the EOS dictionary standard, English text is recorded instead of Turkish
equivalents for ComparativeMeasureStartString and
ComparativeMeasureEndString. This page preserves the dictionary
standard as provided and does not invent new Turkish equivalents.
ColorRegions is a collection that can divide the BULLET_GRAPH chart
range into sections using different colors. In the source code, each region is
represented by the REGION_COLLECTION class.
| Property |
EOS Turkish Equivalent |
Default |
Purpose |
Typical Application |
ColorRegions |
Color Regions |
REGION_COLLECTION[] |
Represents the collection of color regions on the chart. |
Visually distinguishing qualitative performance zones such as normal, warning, and critical. |
RegionColor |
Region Color |
Red |
Specifies the color of the corresponding region. |
Visually identifying a particular value range. |
RegionMax |
Region Maximum |
0 |
Represents the maximum boundary defined for the region in the source code. |
Defining the upper boundary of a color region within the chart range. |
Example Color Regions
For example, on a process indicator with a range of 0–100, color regions
could be configured with maximum boundaries such as 40, 70, and 100. This
allows the operator to see not only the numerical position of the main bar
but also the qualitative performance zone in which it falls. These numbers
are illustrative only; the supplied source code does not define any default
sequence of regions.
Interpreting the BULLET_GRAPH Display
In the example image you provided, the chart is horizontal and displays a scale
from 0 to 100. The orange horizontal bar is the prominent visual element
representing the main measurement's position on the chart. The dark vertical
marker can serve as a reference indicating the comparative measurement.
What Operators Can Read at a Glance
- Bar length: The position of the read SCADA value within the chart range.
- Reference marker: The position of the comparative measurement.
- Scale: The range within which the value falls.
- Color regions: The qualitative performance zone of the value.
- Flow direction: Whether the bar progresses from left to right or right to left.
Compared with a conventional numerical indicator, this structure fits more
contextual information into a small area. However, BULLET_GRAPH is not a
historical trend chart; a separate trend or line chart is required for detailed
analysis of changes over time.
Online research describes a bullet graph as a space-efficient chart that displays
a primary measure together with a target or another reference and qualitative
performance ranges. Tableau notes that bullet graphs are particularly suitable
for quickly evaluating performance against a target and can be used to compare
production levels against performance ranges. IBM Cognos documentation gives
examples of using bullet charts to monitor production measurements such as defect
counts and shipped orders.
Manufacturing and OEE
Can be used to quickly evaluate measurements such as production volume,
quality indicators, defect counts, or shift targets against a target.
IBM includes defect counts and shipped orders among its bullet chart
examples for manufacturing.
Energy and Power Systems
In SCADA applications, it can be configured as a compact comparison
indicator for measurements such as unit active power, load level,
production target, or current value relative to capacity. This use
aligns with the BULLET_GRAPH data structure provided, which follows
the “read value + comparative SCADA value” approach.
Level and Flow
Can be used to monitor process measurements such as tank level,
reservoir level, flow rate, or pump performance together with
target or limit regions.
Infrastructure and IT Monitoring
The bullet graph approach can be used to compare a single performance
metric, such as CPU usage, network utilization, or capacity utilization,
against an expected value. Tableau identifies monitoring network
utilization against expected levels as an example for IT departments.
Capacity and Service Indicators
Bullet graphs are also used to present target-based KPIs, such as
capacity, call volume, or similar metrics, in a compact format.
IBM Cognos documentation provides call center metrics as an example.
Compact KPI Dashboards
Placing multiple bullet indicators side by side or vertically allows
different KPIs to be scanned quickly within the same screen. Tableau
notes that bullet graphs can be used as compact indicators in
multi-metric dashboards.
Key Advantage for SCADA
The main advantage of BULLET_GRAPH on a SCADA screen is that, instead of
dedicating a large indicator to a single process value, it can present the
relationship between current value + comparison + scale + color
region within the same small area. This can be useful in higher-level
operational and control screens where many KPIs need to be monitored together.
Example Scenarios for EOS SCADA
| Scenario |
ReadData / BAR |
ComparativeMeasureData |
Chart Range |
Color Regions |
| Hydroelectric Unit Power |
Instantaneous MW |
Target MW |
Unit rated power |
Based on load condition |
| Reservoir Level |
Current level |
Operating target |
Lower/upper operating range |
Low / normal / high |
| Pump Flow Rate |
Current flow rate |
Target flow rate |
Rated flow rate |
Insufficient / normal / high |
| Production KPI |
Actual value |
Shift target |
Target or capacity |
Performance categories |
| Electrical Load |
Current load |
Reference/planned value |
Upper operating limit |
Normal / warning / critical |
Hydroelectric Power Plant Example
Consider a hydroelectric unit with ReadData = 72 MW,
ComparativeMeasureData = 80 MW, and
GraphRange = 100 MW. The bar progresses to the 72 MW level;
if the comparative measurement is visible, it also displays the 80 MW
reference. When color regions are defined according to the operating
philosophy, the operator can read the current power, target, and performance
zone simultaneously.
Using BULLET_GRAPH in SCADA Screen Design
- For a single KPI: Using BULLET_GRAPH alongside a numerical value makes its position relative to the target visible.
- For multiple KPIs: Several BULLET_GRAPH controls of the same size can be used to create a compact performance dashboard.
- For color regions: Color should communicate performance context rather than serve merely as decoration.
- For comparisons: The colors of the main bar and reference marker should be clearly distinguishable.
- When trends are needed: Use a separate trend chart instead of BULLET_GRAPH to examine behavior over time. Tableau also notes that bullet graphs do not show historical trends and are suitable for rapid status assessment.
Visual Density
A bullet graph is a compact indicator; placing too much information in a
single control can reduce readability. Tableau also notes that bullet graphs
may not be suitable for comparing a large number of items simultaneously.
| Source Code Property |
EOS Turkish Equivalent |
Value / Type |
_ReadData |
Read Data |
string |
_ComparativeMeasureData |
Comparative Measurement Data |
string |
_FlowDirection |
Flow Direction |
BGOrientation |
_GraphRange |
Chart Range |
int |
_FeaturedMeasureColor |
Featured Measure Color |
Color |
_DisplayFeaturedMeasure |
Display Featured Measure |
bool |
_FeaturedStartString |
Featured Start String |
string |
_FeaturedEndString |
Featured End String |
string |
_ComparativeMeasureColor |
Comparative Measurement Color |
Color |
_DisplayComparativeMeasure |
Display Comparative Measure |
bool |
_ComparativeMeasureConstant |
Comparative Measurement Constant |
string |
_ComparativeMeasureStartString |
Comparative Measure Start String |
string |
_ComparativeMeasureEndString |
Comparative Measure End String |
string |
_ColorRegions |
Color Regions |
REGION_COLLECTION[] |
BGOrientation
| Technical Value |
English Equivalent |
Lefttoright |
Left to Right |
Righttoleft |
Right to Left |
REGION_COLLECTION
| Field |
EOS Turkish Equivalent |
Default |
_RegionColor |
Region Color |
Color.Red |
_RegionMax |
Region Maximum |
0 |
Internet Research and References
Current online documentation was reviewed to understand the general visual
principles and applications of bullet graphs. The sources below are not the
source code for EOS SCADA BULLET_GRAPH; they are external references explaining
the general use of the bullet graph approach.
-
Tableau – What is a Bullet Graph? Describes a bullet graph as
a compact chart that combines a primary measure, a target/reference marker,
and qualitative performance ranges. It provides examples from manufacturing,
IT, and KPI dashboards.
View Source.
-
IBM Cognos Analytics – Reporting User Guide Explains how a
bullet chart compares an actual measure with a target and qualitative
performance zones such as good, satisfactory, and poor. It describes
applications including production defect counts and shipped orders.
View Source.
-
Tableau Help – Reference Lines, Bands, Distributions and Boxes
Explains that a bullet graph is a variation of a bar chart and that reference
distributions and target lines can be used together.
View Source.
-
Tableau – Chart Selection Guide Notes that a bullet chart is
suitable for quickly showing progress against a target at a single point in
time, but is not designed for analyzing historical changes.
View Source.
BULLET_GRAPH can be regarded as a powerful, compact user control
in EOS SCADA for presenting a live SCADA value not merely as a number, but through
the relationship between bar + comparison + chart range + color regions.
According to the supplied source code, ReadData defines the main BAR
data, ComparativeMeasureData defines the comparison SCADA data,
GraphRange defines the visual scale, and ColorRegions
defines the collection of color regions. The display direction can be changed
through FlowDirection, while the colors and visibility of the main
and comparative measurements can be configured separately.
Summary
- Live: SCADA data is refreshed according to the update interval.
- Comparative: A separate SCADA data value can be used for comparison.
- Compact: Provides multiple types of contextual information in a small area.
- Color-coded: Color regions can be used to distinguish performance zones.
- Directional: The bar can progress from left to right or from right to left.
- SCADA-focused: Can be adapted to KPI, target, load, power, level, and performance screens.