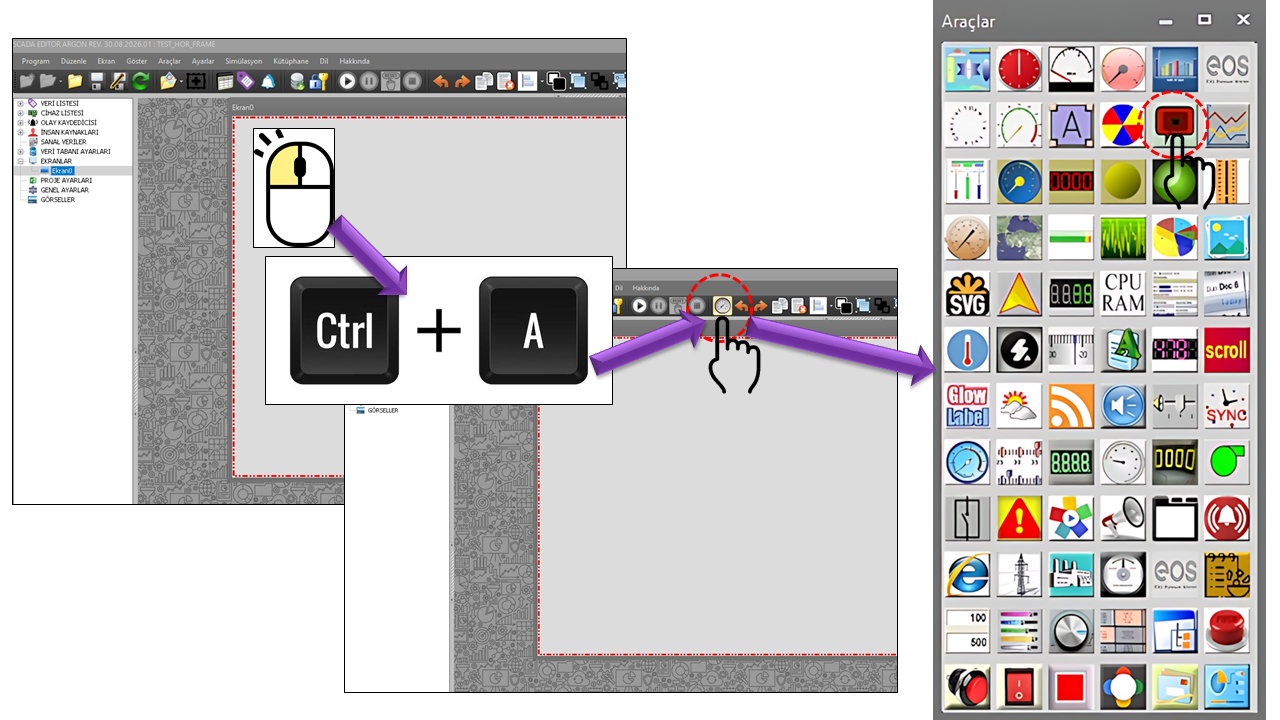
About the COLOR INDICATOR
EXTRA_SHAPES is designed to present data or descriptive text within a visual object on EOS SCADA screens. Its core approach combines data presentation with shape design.
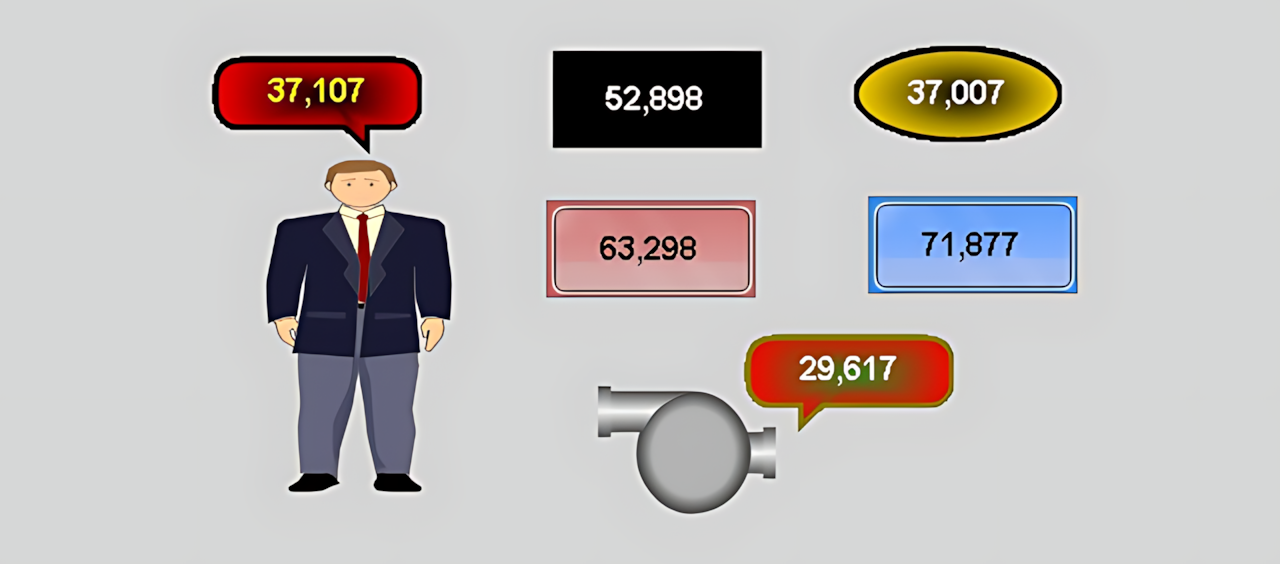
The same data can be displayed in different geometric shapes on a SCADA screen, depending on the design requirements. The shape's color, border, line style, corner geometry, opacity, and gradient can each be configured independently to establish a visual hierarchy on the screen.
Core concept: The COLOR INDICATOR enables data to be associated with a visual object rather than displayed using a conventional numeric indicator. It can therefore be used to visually distinguish status information, areas, equipment, process steps, or information that requires special attention.
The basic configuration properties of the COLOR INDICATOR are listed in the table below. These properties define the control type, update interval, decimal precision, general colors, and font.
| Property |
EOS Turkish Equivalent |
Default |
Description |
UCType |
Control Type |
EXTRA_SHAPES |
Defines the type of the COLOR INDICATOR user control. |
UpdateInterval |
Update Interval |
1000 ms |
Specifies the control's update interval. |
DecimalPoint |
Decimal Places |
0 |
Specifies the number of decimal places used to display the numeric value. |
UCBackColor |
Control Background Color |
RGB(255,255,255) |
Specifies the control's overall background color. |
UCForeColor |
Control Foreground Color |
Black |
Specifies the control's general text/foreground color. |
UCFont |
Control Font |
Arial Narrow, 12 pt, Bold |
Defines the control's basic font properties. |
Shape Types — Enumeration
The ShapeType property determines the basic geometric shape used to display the data. The enumeration offers a wide variety of visual options, ranging from simple geometric shapes to custom shapes.
▢
Rounded Rectangle
Roundedrectangle
◆
Diamond
Diamond
●
Ellipse
Ellipse
▲
Triangle Up
Triangleup
▼
Triangle Down
Triangledown
◀
Triangle Left
Triangleleft
▶
Triangle Right
Triangleright
◈
Northeast Balloon
Ballonne
◈
Southeast Balloon
Ballonse
◈
Northwest Balloon
Ballonnw
◈
Southwest Balloon
Ballonsw
⬡
Custom Polygon
Custompolygon
◕
Custom Pie
Custompie
▣
Glass
Glass
The ShapeText property specifies the text displayed on the shape. This allows the geometric object to serve not merely as a decorative element, but also to convey a description, status, or brief piece of information associated with the data.
Example: To indicate equipment status, text such as IN SERVICE, STANDBY, or another project-defined label can be displayed on the shape. The actual source of the text and how it is generated dynamically are not separately defined in the supplied source code.
The appearance of the COLOR INDICATOR can be configured using properties such as border color, border style, line style, line width, and border visibility.
| Property |
EOS Turkish Equivalent |
Default |
Description |
BorderColor |
Border Color |
RGB(255,0,0) |
Specifies the color used for the shape's border. |
BorderStyle |
Border Style |
None |
Defines the basic frame style of the border. |
BorderLineStyle |
Line Style |
Solid |
Determines how the border line is drawn. |
BorderWidth |
Border Width |
3 |
Specifies the width of the border line. |
DisplayBorder |
Display Border |
true |
Determines whether the border is displayed. |
Border Style — Enumeration
| Enumeration |
English Equivalent |
None |
None |
Fixedsingle |
Fixed Single |
Fixed3d |
Fixed 3D |
Line Style — Enumeration
| Enumeration |
English Equivalent |
Solid |
Solid Line |
Dash |
Dashed Line |
Dot |
Dotted Line |
Dashdot |
Dash-Dot Line |
Dashdotdot |
Dash-Dot-Dot Line |
Custom |
Custom |
Corner Shape and Curvature
The CurveMode and Curvature properties are used to determine how corner regions are shaped, and the degree of curvature, for shapes that support these settings.
| Property |
EOS Turkish Equivalent |
Default |
Description |
CurveMode |
Curve Mode |
None |
Uses an enumeration to specify which corner regions of the shape should be curved. |
Curvature |
Curvature |
1 |
Specifies the shape's curvature value. |
Note: SHSekilTuru defines numerous corner combinations. These allow different corner regions to be selected for curvature, including one corner, two corners, three corners, or all corners.
Transparency and Color Gradient
One of the most important features shaping the visual appearance of the COLOR INDICATOR is the ability to configure transparency and gradient direction alongside center and surrounding colors.
| Property |
EOS Turkish Equivalent |
Default |
Description |
Opacity |
Opacity |
25 |
Specifies the shape's transparency/opacity value. |
CenterColor |
Center Color |
RGB(255,0,0) |
Specifies the color used toward the center of the gradient. |
SurroundColor |
Surrounding Color |
RGB(0,255,255) |
Specifies the color used around the shape. |
GradientMode |
Gradient Mode |
None |
Determines whether a color gradient is used and, if so, its direction. |
Gradient Mode — Enumeration
| Enumeration |
English Equivalent |
Usage |
None |
None |
No gradient is used. |
Horizontal |
Horizontal |
The color gradient is applied horizontally. |
Vertical |
Vertical |
The color gradient is applied vertically. |
ForwardDiagonal |
Forward Diagonal |
The color gradient is applied along the forward diagonal. |
BackwardDiagonal |
Backward Diagonal |
The color gradient is applied along the backward diagonal. |
Use in SCADA Screen Design
In industrial HMI/SCADA software, graphical objects are fundamental design elements that support visual understanding of a process. Rockwell FactoryTalk View uses geometric and free-form drawing objects to visually represent processes and operations, and these objects can be linked to animations associated with real-time data. Siemens WinCC also supports the visual construction of screens through basic graphic objects and symbol libraries. citeturn0search0turn0search13
Within this general approach, EXTRA_SHAPES stands out by combining data visualization and shape customization through the properties of a single user control in EOS SCADA. Shape selection, colors, borders, lines, corners, and gradient settings together define the visual identity of the same object.
Status Indicators
Distinguishing running, standby, disabled, or other project-defined process states using different shapes and colors.
Process Information
Presenting measurement or status information within a visual object rather than a conventional text field.
Alarm and Warning Areas
Highlighting information that requires the operator's attention through distinctive combinations of shapes and colors.
Equipment Status
Representing pumps, valves, motors, and other equipment using visual indicators suited to the project design.
Process Areas
Visually distinguishing different functional or process areas on a SCADA screen.
Custom Screen Designs
Creating visual information blocks tailored to an organization or project, beyond standard indicator styles.
The same control can be used with different visual styles to display a process value. For example, a rounded rectangle may be used for normal operating information, a triangle for a situation requiring directional information, or a diamond or ellipse for a special status area. Color and gradient properties can further strengthen the visual distinction between these objects on the screen.
Design principle: Visual shapes should be used not merely for aesthetic purposes, but to help operators distinguish information more quickly. Consistent use of shapes and colors for states with the same meaning can improve screen learnability and visual consistency.
COLOR INDICATOR (EXTRA_SHAPES) is a flexible user control designed to present data on EOS SCADA screens using a variety of geometric shapes and rich visual properties, rather than displaying it only as text or numbers.
By combining shape types, borders, line styles, curvature, transparency, colors, and gradient options, the same basic control can be adapted to different SCADA screen designs. In this way, EXTRA_SHAPES helps present process data more prominently within a visual hierarchy and in accordance with the project design.