Point Value
Inspecting the values corresponding to a specific point on the graph.
EOS SCADA • GRAPH • LIVE DATA • TREND • USER CONTROL
GRAPH is an advanced user control that allows live process data to be plotted against a time axis on EOS SCADA screens. Multiple data series can be displayed together on a single graph, making it possible to compare related process variables within the same time window.
Depending on its configuration, the control may allow the data selection configuration to be changed during SCADA RUNTIME. This enables the same graph area to be used for different analysis requirements.

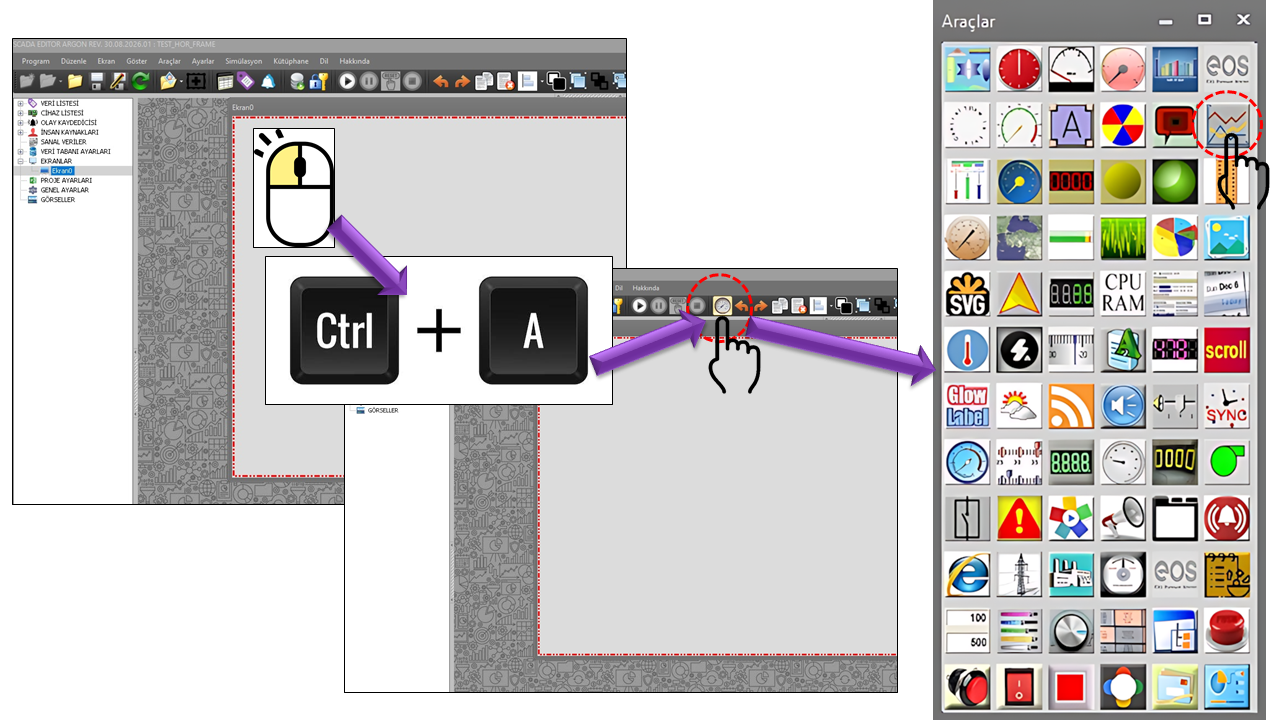
GRAPH allows you to view how a value changes over time alongside its current value on a SCADA screen. This enables the operator to investigate not only “What is the value right now?” but also “How is it changing?” on the same screen.
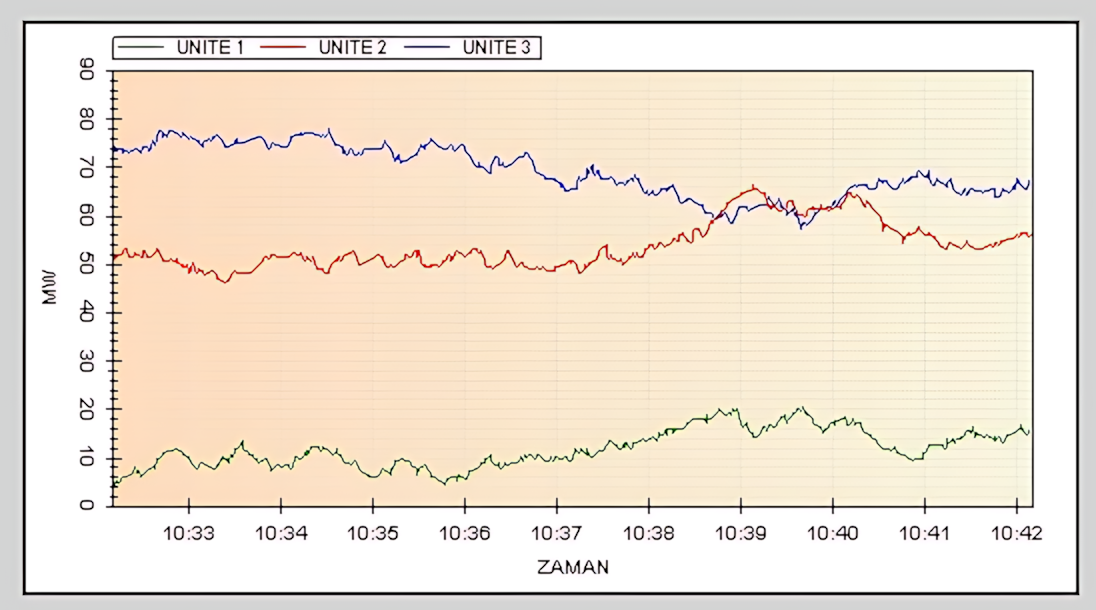
The GRAPH_DATA_COLLECTION structure allows multiple data series to be defined on the same graph. The active state, line color, line width, line style, Y-axis, title, and row ID can be configured separately for each data series.
Multiple SCADA data points can be displayed on the same graph. The Y1 and Y2 axes can be used for data with different scales. For example, active power, reactive power, voltage, and current can be compared along the same time axis.
One of the key features of GRAPH is that graph data selection can be configured to allow changes during SCADA RUNTIME. This allows the graph area to serve different analysis purposes without being restricted to a single fixed group of data.
Graph data, line properties, axes, time range, legend, and other visual properties are configured.
With a suitable configuration, users can select or change graph data within SCADA RUNTIME.
The same graph area can be used to display Active Power + Reactive Power in one analysis, Voltage + Current in another, and Flow Rate + Level in yet another.
Using a large number of GRAPH user controls simultaneously on SCADA screens may adversely affect performance. Each graph requires processing data series, plotting points, rendering axes and grids, and updating the screen.
As the graph's time range increases, the amount of data to be processed and displayed may also increase, potentially adding to the performance load. The impact depends on the number of data points, update rate, number of graphs, data source, and available resources on the Runtime computer.
Therefore, the GRAPH user control should be used where graph information is directly necessary on the process screen. For detailed trend analysis, the GRAPH PANEL feature provided for this purpose in EOS SCADA RUNTIME may be preferable. A graph should not be added merely to make the screen look more graphical.
GRAPH: For displaying a live graph tailored to a specific SCADA screen and its context.
GRAPH PANEL: As a dedicated Runtime feature for comprehensive trend monitoring and graph analysis.
Industrial HMI/SCADA trend applications also commonly use embedded trends and detailed trend tools for different purposes. Rockwell documentation describes features such as real-time and historical data, multiple pens, zoom/pan, and Runtime configuration. It also explains that larger data buffers may require more system resources.
TimeInterval defines the time window displayed by the graph.
| Options Enum | English |
|---|---|
Last10minutes |
Last 10 Minutes |
Last30minutes |
Last 30 Minutes |
Last1hour |
Last 1 Hour |
Last3hours |
Last 3 Hours |
Last6hours |
Last 6 Hours |
Last12hours |
Last 12 Hours |
Last1day |
Last 1 Day |
A long time range does not automatically mean that a performance problem will occur; however, it may increase the workload because more data must be processed and plotted. This effect may be more pronounced when many graphs and multiple data series are used together.
Recommended approach: select the shortest suitable time range that provides enough information to understand process behavior, and use GRAPH PANEL for longer-term analysis.
Each graph data series has its own properties defined through GRAPH_DATA_COLLECTION.
| Property | EOS English Equivalent | Default | Description |
|---|---|---|---|
DataActive |
Data Active | false |
Determines whether the graph data series is active. |
GraphDataName |
Graph Data Name | "" |
Defines the name of the data to be used in the graph. |
DataColor |
Data Color | Green |
Specifies the color of the data line. |
DataWidth |
Data Width | 1 |
Specifies the width of the data line. |
LineStyle |
Line Style | Solid |
Specifies the drawing style of the data line. |
DataYAxis |
Data Y-Axis | Y1 |
Determines whether the data is assigned to the Y1 or Y2 axis. |
DataHeaderText |
Data Header Text | "" |
Specifies the descriptive text for the data series. |
RowID |
Row ID | 1 |
Specifies the row ID within the graph data collection. |
The basic operating properties of the GRAPH user control are listed in the table below.
| Property | EOS English Equivalent | Default | Purpose |
|---|---|---|---|
UCType |
Control Type | GRAFIK |
Defines the type of the user control. |
UpdateInterval |
Update Interval | 1000 ms |
Specifies how often the graph is updated. |
DecimalPoint |
Decimal Places | 0 |
Specifies the number of decimal places displayed for numeric values. |
UCBackColor |
Control Background Color | Transparent |
Specifies the background color of the graph control. |
UCForeColor |
Control Foreground Color | Black |
Specifies the control's default text color. |
UCFont |
Control Font | Arial Narrow, 8.25 pt, Bold |
Specifies the control's default font. |
GraphData |
Graph Data | GRAPH_DATA_COLLECTION[] |
Defines the data series to be displayed in the graph as a collection. |
TimeInterval |
Time Interval | Last10minutes |
Specifies the time window displayed in the graph. |
DisplayZeroLine |
Display Zero Line | true |
Determines whether the zero reference line is displayed. |
DisplayBorder |
Display Border | false |
Determines whether the graph border is displayed. |
DisplayY2AxisLeft |
Display Y2 Axis on the Left | false |
Determines whether the Y2 axis is displayed on the left side. |
UseTrendData |
Use Trend Data | false |
Determines whether trend data is used. |
Multiple axes can be configured to display data series with different scales clearly on the same graph.
| Property | EOS English Equivalent | Default |
|---|---|---|
DisplayXAxis |
Display X Axis | true |
XAxisTitle |
X-Axis Title | TIME |
XAxisColor |
X-Axis Color | Black |
XAxisAngle |
X-Axis Label Angle | 0 |
DisplayYAxis |
Display Y Axis | true |
YAxisTitle |
Y-Axis Title | "" |
YAxisColor |
Y-Axis Color | Black |
DisplayX2Axis |
Display X2 Axis | false |
X2AxisTitle |
X2-Axis Title | TIME |
DisplayY2Axis |
Display Y2 Axis | false |
Y2AxisTitle |
Y2-Axis Title | "" |
Y2AxisColor |
Y2-Axis Color | Black |
The graph's readability can be adjusted using major and minor grid, fill, title, and legend text properties.
| Property | EOS English Equivalent | Default |
|---|---|---|
DisplayMinorGrid |
Display Minor Grid | true |
MinorGridColor |
Minor Grid Color | Gainsboro |
MinorGridDashOn |
Minor Grid Dash On | 1 |
MinorGridDashOff |
Minor Grid Dash Off | 1 |
DisplayMajorGrid |
Display Major Grid | true |
MajorGridColor |
Major Grid Color | Gainsboro |
MajorGridDashOn |
Major Grid Dash On | 1 |
MajorGridDashOff |
Major Grid Dash Off | 1 |
UseChartFill |
Use Chart Fill | false |
FillColor1 |
Fill Color 1 | DarkGray |
FillColor2 |
Fill Color 2 | LightGray |
FillAngle |
Fill Angle | 0 |
TitleText |
Title Text | "" |
TitleColor |
Title Color | Black |
TitleFont |
Title Font | Arial, 16 pt, Regular |
DisplayLegend |
Display Legend | true |
LegendLocation |
Legend Location | Top |
LegendFont |
Legend Font | Arial, 12 pt, Regular |
| Property | EOS English Equivalent | Default | Description |
|---|---|---|---|
UseTextObject |
Use Text Object | false |
Determines whether an additional text object is used on the graph. |
TextObjectText |
Text Object Text | "" |
Defines the content of the text object. |
TextObjectLocation |
Text Object Location | 0,0 |
Specifies the position of the text object. |
DisplayTextObjectBorder |
Display Text Object Border | false |
Determines whether the text object's border is displayed. |
DisplayDynamicData |
Display Dynamic Data | false |
Enables the display of dynamic data. |
NumberOfDynamicData |
Number of Dynamic Data Items | 1 |
Specifies the number of dynamic data items to display. |
GraphID |
Graph ID | "" |
Specifies the graph's identifier. |
LockDesign |
Lock Design | true |
Determines whether the graph design is locked. |
GRAPH can be used not only to display lines but also to inspect the graph.
Inspecting the values corresponding to a specific point on the graph.
Zooming in on specific areas of the graph to examine short-term changes in detail.
Exporting graphs in formats such as GIF and JPEG.
Point-value inspection, zoom, and pan are common Runtime features in industrial trend controls. Rockwell trend documentation describes value bars at data points and zoom/pan operations, while Siemens WinCC Unified documents zooming in by selecting an area of the trend display. citeturn0search8turn0search45
Note: The details of the export method are not visible in the provided GRAPH source code. GIF/JPEG support is described here as a feature specified by the user.
LegendLocation allows the graph legend to be displayed in different positions.
| Options Enum | English |
|---|---|
Bottom |
Bottom |
Bottomcenter |
Bottom Center |
Bottomflushleft |
Bottom Left-Aligned |
Float |
Floating |
Insidebotleft |
Inside Bottom Left |
Insidebotright |
Inside Bottom Right |
Insidetopleft |
Inside Top Left |
Insidetopright |
Inside Top Right |
Left |
Left |
Right |
Right |
Top |
Top |
Topcenter |
Top Center |
Topflushleft |
Top Left-Aligned |
GRAPH should be used when viewing graph data alongside other information on the process screen provides a practical benefit.
Monitoring variables such as active power, reactive power, voltage, and current together.
Examining pressure, flow rate, speed, and current behavior over time.
Comparing level, inlet/outlet flow rates, and related variables.
Monitoring changes in power, energy, voltage, and load.
Comparing process values before and after an event.
Examining changes in equipment behavior using multiple data series.
GRAPH is a powerful user control that transforms EOS SCADA screens into analytical workspaces where live process trends can be viewed. Features such as displaying multiple data series on one graph, Y1/Y2 axes, time ranges, legends, grids, dynamic data, and Runtime data selection make the control flexible.
However, large numbers of GRAPH controls, multiple data series, and unnecessarily long time ranges can increase the processing and rendering load during Runtime. Using the GRAPH PANEL feature in EOS SCADA for detailed trend analysis can meet analysis needs while keeping screens uncluttered.
Summary: GRAPH = Live Data + Multiple Data Series + Time Axis + Runtime Inspection + Zoom + Point Value + Image Export.
Free Software Download Center
Software for industrial data collection, monitoring, and analysis.

Technical Support
Software documentation, sample code, and practical technical information.
You can contact us regarding EOS software, technical documentation, or industrial data communication.