Temperature Monitoring
It can be used to read continuously changing values such as temperature against a central reference. Linear gauges are commonly used for the visual presentation of measurements such as temperature.
EOS SCADA • KAYAR_GOSTERGE • SLIDING SCALE • USER CONTROL
SLIDING SCALE INDICATOR is a specialized indicator design in which scale values move relative to a fixed central reference. It is particularly useful for making small variations easy to read within a narrow operating range, such as frequency and grid frequency.
Instead of moving the pointer over a long distance as in conventional gauges, the central needle remains fixed while the scale strip moves according to the value. This makes it possible to identify at a glance the direction and magnitude of deviations from the nominal center, especially when monitoring small frequency variations around 50 Hz.

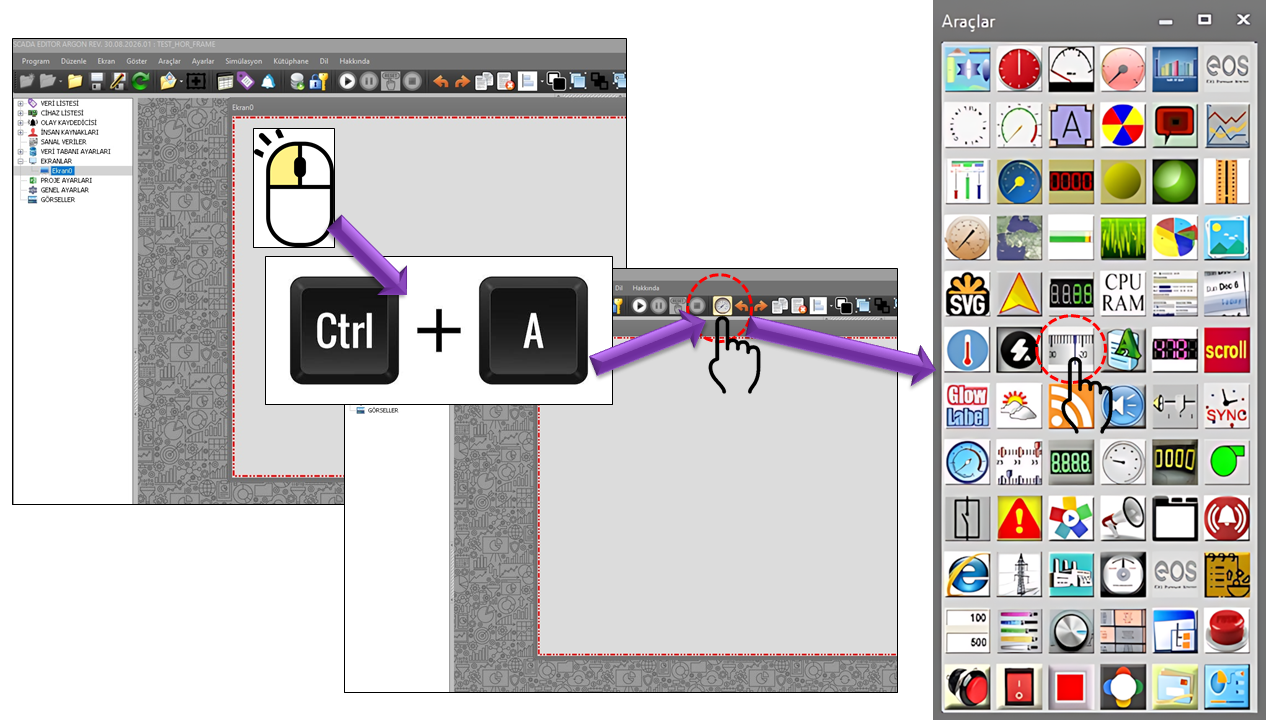
ROLLING GAUGE is a display technique in which a linear scale moves around a fixed central indicator. The source code provided by the user defines fundamental visual parameters such as the scale value, scale range, minor and major tick counts, needle color, shadow, and horizontal or vertical orientation.
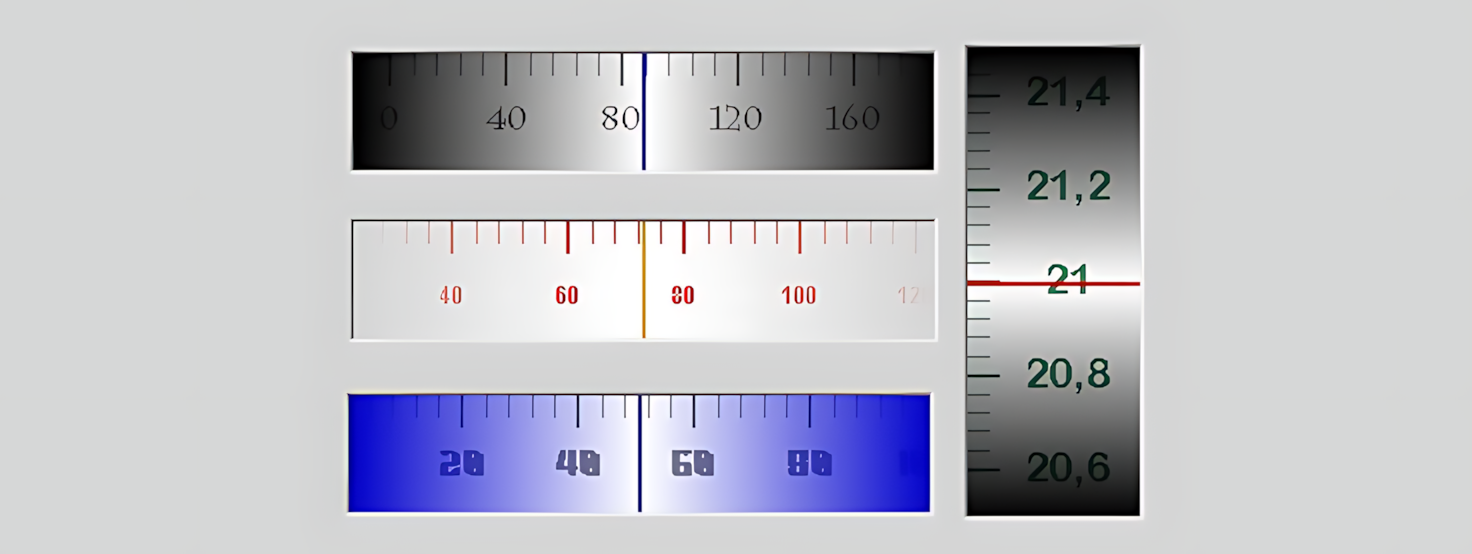
The defining characteristic that distinguishes this control from a conventional linear gauge is that the indicator remains fixed at the center while the scale moves. In industrial HMI literature, this approach is also referred to as a “rolling scale” or “ribbon gauge.” SimWB documentation explicitly states that the indicator remains centered in a ribbon gauge while the scale moves horizontally or vertically to align the current value with the center.
The primary mechanism that makes the ROLLING GAUGE easy to read is the fixed reference + moving scale arrangement.
As the value changes, the numerical scale shifts relative to the central reference.
The needle or center line remains fixed; the reading point does not change.
Instead of following the entire scale, the operator reads the value positioned above or below the center line. Because the reference point the eye follows remains unchanged as the value changes, this design can provide a simpler reading experience, particularly for rapidly changing analog processes.
Internet research indicates that the fixed-indicator, moving-scale approach is used as a variation of the linear gauge family. Actipro documents the “rolling scale” approach, in which the scale and ticks move behind a fixed pointer; SimWB documents how a horizontal or vertical ribbon gauge aligns the scale's current value with the centered indicator.
It can be used to read continuously changing values such as temperature against a central reference. Linear gauges are commonly used for the visual presentation of measurements such as temperature.
Linear gauge designs are used to read continuously changing process variables such as pressure, differential pressure, and flow rate.
It can be adapted to monitor level or volume information on a continuous scale in tanks, reservoirs, and similar processes.
This is one of the most notable applications of the ROLLING GAUGE. In electrical systems, it provides a suitable visual approach for reading small deviations around the nominal frequency of 50 Hz against a central reference. Changes below or above the nominal frequency can be monitored directly through the movement of the scale relative to the fixed center line.
A center-referenced visual display can be designed for continuous numerical values such as power, load, and current on SCADA screens. This application adapts the control's general linear gauge approach to SCADA.
It can be considered for processes where speed, load, process temperature, or other continuous variables need to be associated with a fixed reading point on the operator screen.
It can be used to visually monitor the instantaneous position of a process variable around a specified operating range using a central reference.
One particularly noteworthy application of the ROLLING GAUGE is monitoring electrical frequency. In power systems, frequency is an important indicator of the instantaneous balance between generation and consumption. When it is necessary to quickly identify the direction and magnitude of small deviations from the nominal value, a moving-scale design with a fixed central reference is especially useful.
The nominal frequency of the Turkish electricity system is 50 Hz. TEİAŞ technical documents specify a nominal frequency of 50 Hz and define requirements for maintaining frequency within specified limits under normal grid operating conditions, with wider operating ranges under exceptional conditions. Therefore, a moving scale with a fixed center reference can provide a meaningful visual representation when displaying closely spaced values such as 49.9 Hz, 50.0 Hz, or 50.1 Hz on a SCADA screen.
The nominal or reference frequency can be positioned at the center line of the gauge. This allows the operator to immediately recognize whether the value is below or above the reference.
When the frequency falls below the nominal value, the direction of scale movement can visually highlight the decrease relative to the central reference. This can improve rapid situational awareness, particularly on power generation and transmission screens.
When the frequency rises above the nominal value, the same fixed-center principle shows the deviation in the opposite direction. This makes it possible to read frequency changes in both directions around a single reference.
While monitoring a value such as Grid Frequency = 50.00 Hz on the main SCADA screen of a power plant, the center line can be configured to represent the 50 Hz reference. When the scale moves within a narrow operating band such as 49.8–50.2 Hz, very small frequency changes can be perceived as substantial visual movement. The operating range and thresholds must be determined separately according to the actual system's operating criteria.
Note: This suggested application adapts the control's fixed-center, moving-scale structure to frequency monitoring. The source code does not define a dedicated function explicitly named “grid frequency”; this is a potential SCADA application of the control's general display capabilities.
In a conventional linear gauge, the indicator moves along the scale. In a rolling gauge, this visual relationship is reversed: the indicator remains fixed while the scale moves. This approach makes it possible to perceive the direction and magnitude of a value change through movement around the center. For this reason, the rolling-scale approach is particularly useful in interfaces where continuous variables need to be read against a fixed reference.
The properties defined in the source code and their current EOS Turkish dictionary equivalents are listed below.
| Property | EOS Turkish Equivalent | Default | Description |
|---|---|---|---|
| UCType | Control Type | KAYAR_GOSTERGE | Specifies the type of the user control. |
| UpdateInterval | Update Interval | 1000 | Specifies the control's update interval in milliseconds. |
| DecimalPoint | Decimal Places | 0 | Specifies the number of decimal places used to display numeric values. |
| UCBackColor | Control Background Color | White | Specifies the background color of the control. |
| UCForeColor | Control Text Color | Gray | Specifies the foreground/text color of the control. |
| UCFont | Control Font | Arial Narrow 8.25 | Specifies the control's primary font. |
| ScaleValue | Scale Value | 0 | Specifies the scale value used as the basis for the display. |
| ScaleRange | Scale Range | 100 | Specifies the value range covered by the scale. |
| SmallTickCount | Minor Tick Count | 4 | Specifies the number of minor tick marks on the scale. |
| LargeTickCount | Major Tick Count | 5 | Specifies the number of major tick marks on the scale. |
| NeedleColor | Needle Color | Blue | Specifies the color of the fixed central indicator/pointer. |
| ShadowEnabled | Shadow Enabled | true | Enables or disables the use of a shadow in the gauge visualization. |
| ShadowColor | Shadow Color | Black | Specifies the color used when the shadow is enabled. |
| Orientation | Orientation | Horizontal | Specifies whether the gauge is oriented horizontally or vertically. |
The ROLLING GAUGE builds its display around three main components: the scale, the ticks, and the central indicator. As the value changes, the scale moves while the central indicator remains fixed, continuously preserving the reference point for the measured value.
ScaleValue and ScaleRange configure the visual behavior of the scale value and the range it covers.
SmallTickCount and LargeTickCount determine the number of minor and major ticks.
NeedleColor determines the visual color of the fixed central reference; shadow settings can further emphasize it visually.
The fundamental visual principle of this control is based on a moving scale rather than a moving pointer. Therefore, the documentation should use the phrase “the central reference remains fixed while the scale shifts according to the value” rather than “the pointer moves.”
The Orientation property allows the control to be used horizontally or vertically. Industrial ribbon gauge examples also document the application of the same principle to both horizontal and vertical scales.
Suitable for reading production, energy, speed, pressure, and other continuous values against a horizontal central reference.
The same fixed-center approach can be used for level, temperature, or process screens where a vertical layout is more appropriate.
The orientation should be selected by considering the layout of surrounding SCADA graphics and the operator's visual workflow.
The ROLLING GAUGE can be used in SCADA designs where many similar analog values need to be monitored on the same screen. Keeping the central reference in the same position can make it easier to compare gauge movements at different values.
Because the central reference remains fixed, the operator's reading point does not continually move. This is particularly valuable when monitoring small frequency deviations.
Tick counts help balance gauge readability against the available screen space.
The needle color and use of shadows help distinguish the moving scale from the fixed central reference.
Unlike the conventional linear display approach, the ROLLING GAUGE has a distinctive display structure that keeps the central reference fixed while moving the scale. This structure makes it easier to track small changes in value relative to the central reference.
Properties such as Scale Value, Scale Range, Minor Tick Count, Major Tick Count, Needle Color, Shadow Enabled, Shadow Color, and Orientation allow the scale structure, tick arrangement, and central reference to be configured visually.
The value changes → the scale moves → the central needle remains fixed → the value is read against the central reference.

Free Software Download Center
Software for industrial data collection, monitoring, and analysis.

Technical Support
Software documentation, sample code, and practical technical information.
You can contact us regarding EOS software, technical documentation, or industrial data communication.