Normal Range
Values below the thresholds, or within the operating range considered normal by the project, can be monitored using the default display color.
LBBASIT_GOSTERGE • DIGITAL SEGMENT NUMERIC DISPLAY • USER CONTROL
LBBASIT_GOSTERGE is a simple, easy-to-read user control designed to display numerical process values using the traditional digital segment display style. In addition to presenting values directly as digits, features such as two-level threshold colors, flashing, and a fast chart can provide additional operational information within the same numerical display area.

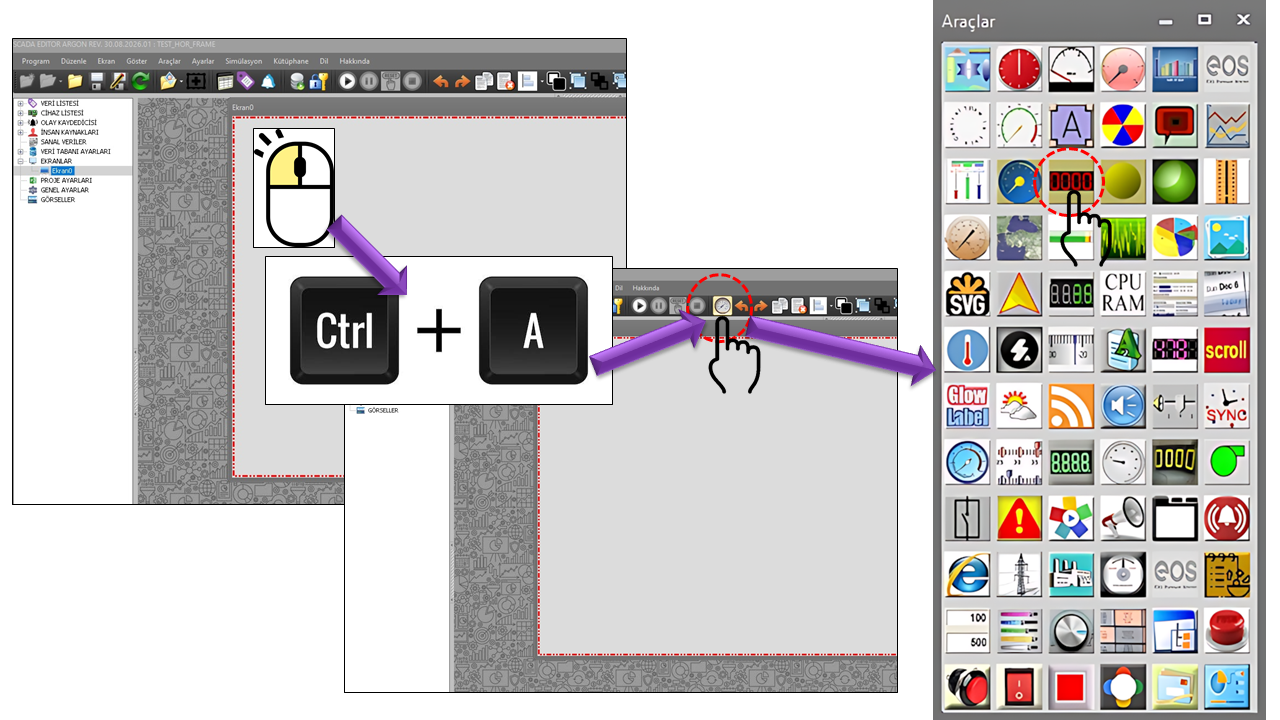
Digital numeric indicators are fundamental visual components on SCADA screens, allowing process values to be read directly. LBBASIT_GOSTERGE presents this approach using a segment-based numeric display. It provides a simple display, particularly in compact screen areas where measurement values need to be read quickly.
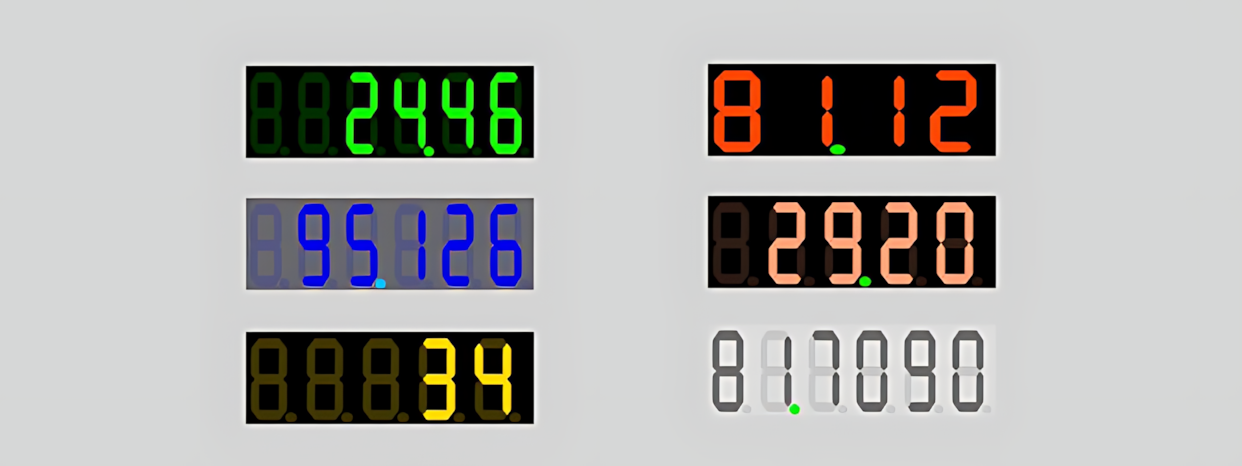
The control does not have to be used solely to "display a number." With thresholds, the display color can change when a value reaches predefined levels; blinking can visually highlight a condition requiring attention. This adds status information to the value indicator itself without requiring a separate alarm definition for every change.
The control displays the connected process value using a digital segment format according to the specified formatting rules. If threshold, color, and blinking behaviors can also be applied, the displayed number can provide a visual indication of the operating range in which the value lies.
With LBBASIT_GOSTERGE, the operator can read both the numeric value and its visual status according to the defined thresholds at the same time.
When UseThreadhold is enabled, two separate threshold levels can be defined. Selecting a different color for each threshold makes it easier to interpret the numeric value not only as a number but also as an operating state.
Values below the thresholds, or within the operating range considered normal by the project, can be monitored using the default display color.
A different color can be used when the first attention level is reached, using ThreadholdValue1 and ThreadholdColor1.
A more prominent visual state can be created at the second level using ThreadholdValue2 and ThreadholdColor2.
When UseBlink is enabled, the display can blink. BlinkSpeed determines the speed of this behavior. In this way, in addition to the value changing, a condition requiring the operator's attention can be highlighted through a dynamic visual indicator.
LBBASIT_GOSTERGE also supports audible warnings through the UseSoundWarning property. When this feature is enabled, an audible warning can supplement the visual display for the condition represented by the displayed value. This allows the operator to rely not only on the screen's color, threshold, or blinking behavior, but also on an audible alert.
When UseBlink and UseSoundWarning are considered together, LBBASIT_GOSTERGE allows multiple attention mechanisms to be used for the same data. This approach can be useful for quickly identifying threshold exceedances or process conditions requiring the operator's attention.
Using blinking or audible warnings simultaneously on too many indicators can make the screen more difficult for the operator to interpret and cause unnecessary distraction. Associating these features only with values or conditions that genuinely require attention helps keep visual and audible warnings meaningful.
When UseFastGraph is enabled, a small graph icon appears in the lower corner of the control. When the mouse pointer is placed over this icon, a quick graph is displayed for the selected time range. The graph closes when the pointer moves away from the icon. This allows the operator to quickly check the recent behavior of the current value without switching to a separate trend screen.
This approach provides short-term trend context alongside the numeric display. Information such as sudden increases, decreases, fluctuations, or the persistence of value changes can be viewed quickly through a single control.
A single instantaneous value shows where the process stands at that moment. A trend provides additional context about the direction and rate of change. Therefore, the quick graph is a supplementary analysis tool that complements the numeric display.
LBBASIT_GOSTERGE can be particularly useful on SCADA screens where many analog or calculated values must be displayed compactly. While the numeric value can be read directly, threshold colors and optional blinking provide an additional visual layer indicating whether the value is within an operating range that requires attention.
Can be used for compact numeric displays of temperatures in furnaces, boilers, tanks, process lines, and machinery.
Enables quick reading of numeric process values such as line, tank, and equipment pressure.
Can be used for compact displays of continuously changing variables such as tank level and liquid or gas flow rate.
Can be used to present measurements such as voltage, current, power, and frequency directly as numeric values.
Suitable for monitoring speed, rotational rate, vibration, temperature, and other machine measurements on the screen.
Can serve as a general-purpose numeric indicator for various continuous process variables with defined minimum and maximum operating ranges.
The following properties configure the control's basic numeric display structure, appearance, threshold behavior, warning mechanism, and quick graph feature.
| Property | English Meaning | Default | Description |
|---|---|---|---|
UCType |
Control Type | LBBASIT_GOSTERGE |
Defines the type of the user control. |
UpdateInterval |
Update Interval | 1000 ms |
Determines the control's data update interval. |
DecimalPoint |
Decimal Places | 0 |
Determines the number of decimal places used in the numeric display. |
UCBackColor |
Control Background Color | Black |
Determines the control's background color. |
UCForeColor |
Control Foreground Color | Lime |
Determines the control's default foreground/display color. |
UCFont |
Control Font | Arial Narrow 8.25 Bold |
Determines the control's font settings. |
DecimalSeperatorColor |
Decimal Separator Color | Lime |
Determines the color of the decimal separator. |
ValueFormat |
Value Format | 00.00 |
Determines the format used to display the numeric value in the segment display. |
UseSigned |
Use Signed Values | false |
Determines whether signed value display is used. |
OffSegmentsColor |
Inactive Segment Color | 5 |
Determines the value used to display inactive segments. |
| Property | English Meaning | Default | Description |
|---|---|---|---|
UseThreadhold |
Use Threshold | false |
Enables threshold-based color changes. |
ThreadholdValue1 |
Threshold Value 1 | 50 |
Defines the first threshold level. |
ThreadholdColor1 |
Threshold Color 1 | Yellow |
Defines the color used for the first threshold. |
ThreadholdValue2 |
Threshold Value 2 | 100 |
Defines the second threshold level. |
ThreadholdColor2 |
Threshold Color 2 | Red |
Defines the color used for the second threshold. |
UseSoundWarning |
Use Audible Warning | false |
Determines whether the configured audible warning behavior is used. |
UseBlink |
Use Blinking | false |
Enables blinking behavior in the value display. |
BlinkSpeed |
Blink Speed | 500 ms |
Determines the blinking speed. |
| Property | English Meaning | Default | Description |
|---|---|---|---|
UseFastGraph |
Use Quick Graph | false |
Enables the quick graph icon on the control and quick trend viewing. |
FastGraphTimeInterval |
Quick Graph Time Interval | Last30minutes |
Determines the data time range displayed when the quick graph is opened with the mouse. |
| Option Value | English Meaning | Displayed Time Range |
|---|---|---|
Last10minutes |
Last 10 Minutes | Data from the last 10 minutes |
Last30minutes |
Last 30 Minutes | Data from the last 30 minutes |
Last1hour |
Last 1 Hour | Data from the last hour |
Last3hours |
Last 3 Hours | Data from the last 3 hours |
Last6hours |
Last 6 Hours | Data from the last 6 hours |
Last12hours |
Last 12 Hours | Data from the last 12 hours |
Last1day |
Last 1 Day | Data from the last day |
The quick graph is a supplementary feature that allows the operator to quickly review the historical behavior of a value. However, unnecessarily enabling quick graph mechanisms simultaneously across many user controls can create additional processing overhead, especially on densely populated screens.
UseFastGraph should be enabled only for indicators where trend information is genuinely useful to the operator. Rather than equipping numerous controls with the quick graph feature, a suitable screen design approach is to prioritize critical or important process values that help the operator make decisions.
In general HMI/SCADA documentation, trends are used to monitor how process values behave over time. Selecting appropriate trend sampling and update frequencies is also important for system behavior.
| Scenario | Display Approach | Additional Visual Information |
|---|---|---|
| Normal process value | Static digital segment display | Default color |
| First threshold | Numeric value remains displayed in the same way | Threshold Color 1 |
| Second threshold | Numeric value remains displayed in the same way | Threshold Color 2 |
| Condition requiring attention | Value display continues | Blinking |
| Investigating changes | Instantaneous value is displayed | Quick graph |
Digital digits should be large enough, taking screen resolution and the operator's viewing distance into account.
Threshold colors should have consistent meanings throughout the project; the same color should not represent different states on different screens.
If the historical behavior of a value is important, the Quick Graph feature can be enabled for the relevant indicators.
LBBASIT_GOSTERGE is a compact SCADA user control that uses a simple digital segment display not only to show instantaneous numeric values, but also to visually communicate the operating status of those values.
When two-level threshold colors, blinking, and Quick Graph are considered together, a small screen area can provide information about the current value, its status, and its recent behavior.
Instantaneous value → threshold state → visual color / blinking → quick trend when needed. A single numeric display can therefore provide the operator with multiple layers of monitoring information.
Free Software Download Center
Software for industrial data collection, monitoring, and analysis.

Technical Support
Software documentation, sample code, and practical technical information.
You can contact us regarding EOS software, technical documentation, or industrial data communication.