MACTRACKBAR
Displays the position of the current value on a linear scale. Its purpose is monitoring and visual assessment.
EOS SCADA • MACTRACKBAR • LINEAR INDICATOR • PROCESS VALUE
LINEAR INDICATOR (MACTRACKBAR) is an EOS SCADA user control designed to visually display connected numerical data along a linear scale within a defined minimum–maximum value range.
The control can be arranged horizontally or vertically, display tick marks and numerical labels along the scale, and highlight the current value's position using a marker. Rather than presenting a numerical value only as digits, MACTRACKBAR provides a compact linear display that also shows operators where the value lies on the scale.

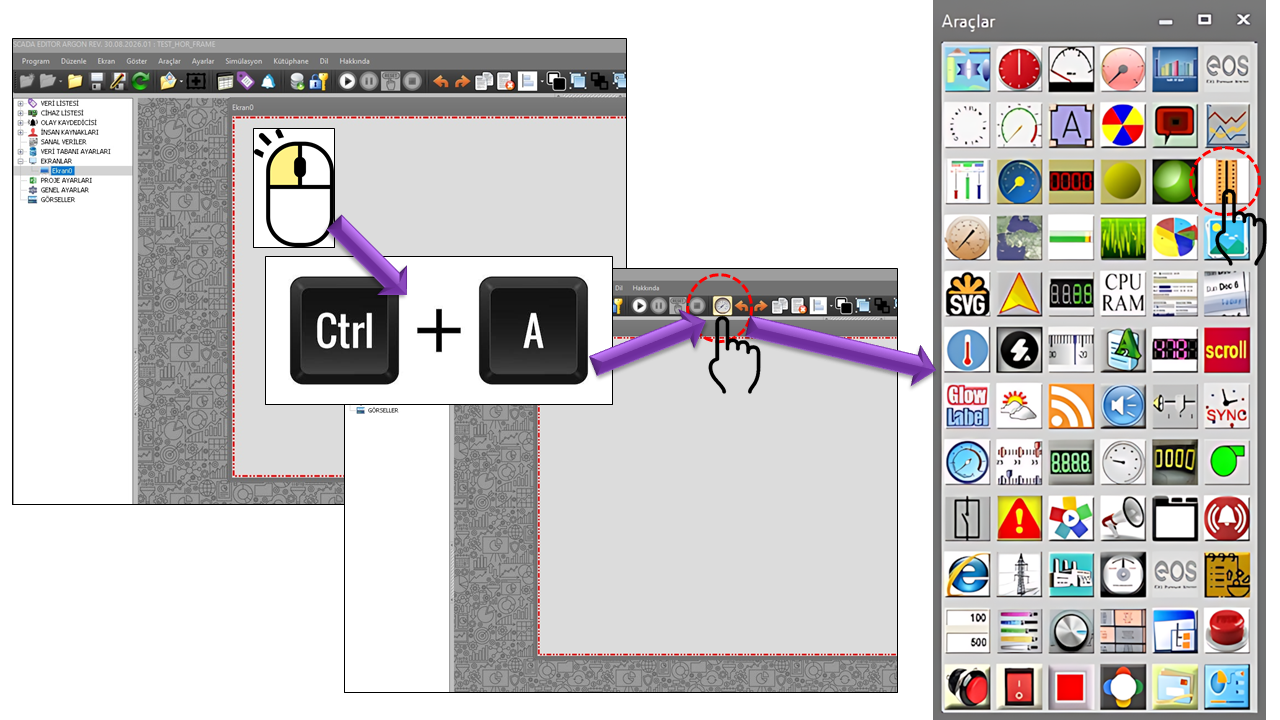
MACTRACKBAR is a user control used to visually display a numerical process value on a linear scale between defined minimum and maximum values. Instead of presenting the value solely as numerical information, the control also visually communicates the position of that value on the scale to the operator.
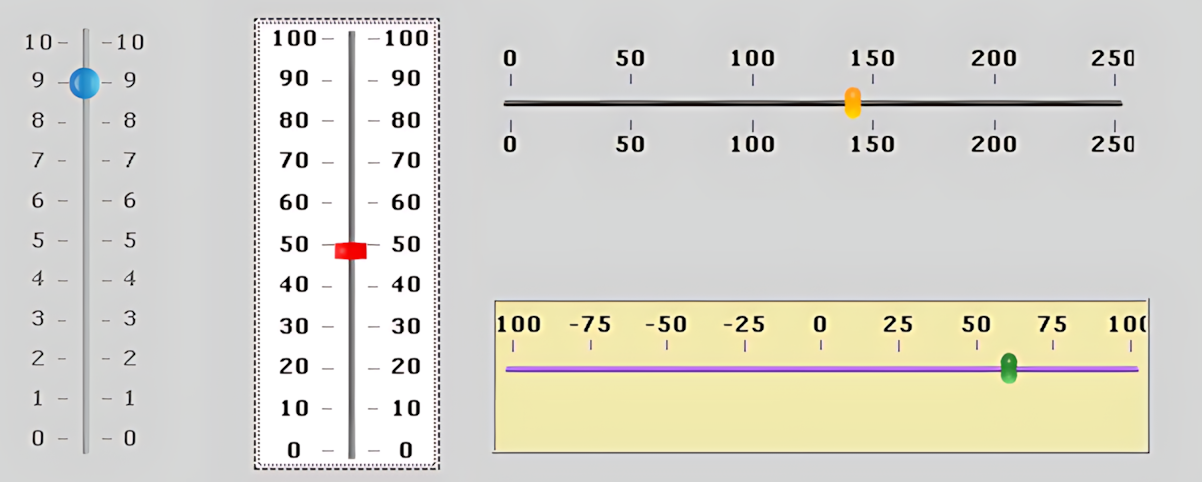
In the example shown, MACTRACKBAR is oriented vertically, and the scale is configured over the range 0–10. Tick marks and numerical labels are used for each value interval, while the blue tracker indicates the corresponding position of the displayed value on the scale.
The ability to configure the control in either a horizontal or vertical orientation allows it to adapt to different screen layouts and ways of presenting process information. The tracker's shape, color, and size, as well as the scale line, tick marks, and border appearance, can also be configured independently.
The primary purpose of MACTRACKBAR is not to adjust a value or write data to a controller, but to present the existing value to the operator through an easily understood linear display. It is therefore particularly useful on monitoring-oriented SCADA and HMI screens, where operators need to quickly assess the position of a process value within a specified range.
In this respect, MACTRACKBAR differs from a conventional numerical indicator or fill bar by representing the value through its position on a linear ruler. Even without reading the numerical value, the operator can visually assess whether the value is close to the lower limit, the middle of the range, or the upper limit.
Minimum value → linear scale → current value → maximum value. The value supplied to MACTRACKBAR for display is positioned on the linear scale according to its location between the defined minimum and maximum values. As the value changes, the tracker's position is updated accordingly.
The control therefore visually communicates not only "what the value is", but also "where it is on the scale." This approach is particularly useful for quickly monitoring continuously changing values such as temperature, pressure, level, flow rate, speed, and similar process variables.
Important: MACTRACKBAR is a display control. According to the supplied definition, it is not intended for the operator to change a process value by moving the tracker or to write data to a controller. Its purpose is to display the current value clearly and compactly on a defined linear scale.
MACTRACKBAR's visual structure relies on several basic components working together. The value range is defined, the scale visualizes that range, tick marks improve readability, and the tracker indicates the current value's position on the scale.
The tracker is the moving indicator that shows the graphical representation of the data value. In the supplied source code, the tracker's shape, color, and size are defined through separate properties, allowing the control's visual appearance to be adapted to the application's design.
According to the supplied source definition, MACTRACKBAR should be used for display purposes only. Its source code does not define functionality for writing a value to a controller through operator interaction, changing a setpoint, or controlling a process value.
Therefore, MACTRACKBAR should be regarded as an indicator that presents connected process information linearly on the screen, rather than as a setting slider or a command input element.
This distinction is important in SCADA screen design. Although the tracker visually resembles a slider, the control's primary purpose is not to let the operator change the value, but to enable the operator to monitor the current value quickly.
Displays the position of the current value on a linear scale. Its purpose is monitoring and visual assessment.
In some HMI products, slider objects allow operators to change a connected value by dragging the slider. This behavior is not present in the supplied MACTRACKBAR source code.
The Orientation property defines the basic direction of
the linear indicator on the screen. The source code provides two options:
Horizontal and Vertical.
Values are displayed along a vertical axis. The example provided by the user uses this arrangement, which is particularly suitable for layouts where a narrow but tall area of the screen is available.
The scale is placed along the horizontal axis. This orientation may be preferred in wide-screen layouts or where a horizontal direction better suits the process flow.
Orientation is not merely a visual preference; it also affects how the control is positioned alongside other process objects on the screen.
The primary visual element that indicates the current value on the
scale in MACTRACKBAR is the tracker. In the source code,
the tracker's appearance is configured independently through the
TrackerShape, TrackerColor, and
TrackerSize properties.
| Property | EOS English Equivalent | Default | Description |
|---|---|---|---|
TrackerShape |
Tracker Shape | Ellipse |
Defines the shape of the tracker that indicates the value's position. |
TrackerColor |
Tracker Color | RGB(24, 130, 198) |
Defines the tracker's primary color. |
TrackerSize |
Tracker Size | 16 × 16 |
Defines the tracker's width and height. |
TrackLineColor |
Track Line Color | RGB(90, 93, 90) |
Defines the color of the linear track along which the tracker moves. |
The tracker is the element of the linear indicator that operators recognize most quickly. Therefore, when selecting the Tracker Color and Tracker Size, it is important to ensure sufficient visual contrast against the screen background, scale lines, and numerical labels.
MinValue and MaxValue define MACTRACKBAR's
linear display range. In the supplied source code, their default values
are defined as 0 and 10.
The scale range affects not only the control's appearance but also how the operator interprets the value. For example, small changes become more noticeable in the tracker's position over a narrow range, whereas the same changes may appear visually smaller over a much wider range.
Minimum and maximum values should be selected according to the meaningful operating range of the process. If the scale values are disconnected from the actual process range, the linear indicator may show a technically correct position while making visual assessment more difficult for the operator.
One of the key elements that makes MACTRACKBAR readable as a linear
indicator is its tick marks. TickStyle
determines which side of the scale the ticks appear on, while
TickColor, TickFrequency, and
TickHeight define their visual appearance and spacing.
TextTickStyle controls the placement of numerical labels.
| Property | EOS English Equivalent | Default | Description |
|---|---|---|---|
TickStyle |
Tick Style | Both |
Defines the position of tick marks on the scale. |
TickColor |
Tick Color | RGB(148, 146, 148) |
Defines the color of the tick marks. |
TickFrequency |
Tick Frequency | 1 |
Defines the value interval at which tick marks repeat along the scale. |
TickHeight |
Tick Height | 4 |
Defines the visual height of the tick marks. |
TextTickStyle |
Text Tick Style | Both |
Defines where numerical scale labels are displayed. |
In the example provided by the user, tick marks and numbers appear at every integer across the 0–10 range, with numerical labels displayed on both sides of the scale. This creates a compact layout that makes the value of a narrow linear indicator easy to read.
The BorderColor and BorderType properties
control the appearance of the control's outer frame. In the default
source definition, BorderType is set to None,
so the example control does not have a prominent outer border.
| Enumeration | Option |
|---|---|
MCCerceve |
None |
MCCerceve |
Dashed |
MCCerceve |
Dotted |
MCCerceve |
Inset |
MCCerceve |
Outset |
MCCerceve |
Solid |
MCCerceve |
Adjustable |
MCCerceve |
Raised |
MCCerceve |
Etched |
MCCerceve |
Flat |
MCCerceve |
Raised |
MCCerceve |
Inner Raised |
MCCerceve |
Outer Raised |
MCCerceve |
Sunken |
MCCerceve |
Inner Sunken |
MCCerceve |
Outer Sunken |
The MCKonum enumeration used by TickStyle
and TextTickStyle controls which side of the control
displays scale marks and numerical labels.
| Enumeration | Option | Purpose |
|---|---|---|
MCKonum |
None | Can be used to disable tick or text display. |
MCKonum |
Top Left | Provides display on one side, depending on orientation. |
MCKonum |
Bottom Right | Provides display on the opposite side only. |
MCKonum |
Both | Displays on both sides. |
Displaying numerical values on both sides, as shown in the user's example, is a distinctive design choice that improves the readability of a narrow linear control. Particularly for vertical indicators, labels on both sides of the central axis around which the tracker moves can help operators match values quickly.
The following table summarizes the main properties found in the supplied MACTRACKBAR source code and their default values.
| Property | EOS English Equivalent | Default | Purpose |
|---|---|---|---|
UCType |
Control Type | MACTRACKBAR |
Defines the type of the user control. |
UpdateInterval |
Update Interval | 1000 ms |
Defines the control's data/visual update interval. |
DecimalPoint |
Decimal Places | 0 |
Defines the number of decimal places used for numerical display. |
UCBackColor |
Control Background Color | Transparent |
Defines the control's primary background color. |
UCForeColor |
Control Foreground Color | RGB(123, 125, 123) |
Defines the control's primary text color. |
UCFont |
Control Font | Verdana, 8.25 pt, Bold |
Defines the control's primary font. |
Orientation |
Orientation | Vertical |
Defines whether the control is horizontal or vertical. |
TrackerShape |
Tracker Shape | Ellipse |
Defines the shape of the tracker that indicates the value's position. |
TrackLineColor |
Track Line Color | RGB(90, 93, 90) |
Defines the color of the track line. |
BorderColor |
Border Color | Black |
Defines the color of the control's frame. |
BorderType |
Border Type | None |
Defines the visual style of the control's frame. |
MinValue |
Minimum Value | 0 |
Defines the lower limit of the linear scale. |
MaxValue |
Maximum Value | 10 |
Defines the upper limit of the linear scale. |
TrackerColor |
Tracker Color | RGB(24, 130, 198) |
Defines the color of the tracker indicating the current value. |
TrackerSize |
Tracker Size | 16 × 16 |
Defines the size of the tracker. |
TickStyle |
Tick Style | Both |
Defines the position of the tick marks. |
TickColor |
Tick Color | RGB(148, 146, 148) |
Defines the color of the tick marks. |
TickFrequency |
Tick Frequency | 1 |
Defines how frequently tick marks repeat according to the value interval. |
TickHeight |
Tick Height | 4 |
Defines the height of the tick marks. |
TextTickStyle |
Text Tick Style | Both |
Defines the position of numerical scale labels. |
MACTRACKBAR's visual behaviors are defined through enumerations in the source code. This structure allows the control's orientation, tracker shape, frame style, and tick positions to be managed through predefined options.
| Enumeration | Options | Purpose |
|---|---|---|
GNOrientasyon |
Horizontal, Vertical | Defines the indicator's primary orientation. |
MCSurgu |
Ellipse, Rectangle | Defines the tracker's shape. |
MCCerceve |
None, Dashed, Dotted, Inset, Outset, Solid, Adjustable, Raised, Etched, Flat, Raised, Inner Raised, Outer Raised, Sunken, Inner Sunken, Outer Sunken | Defines the visual style of the control's frame. |
MCKonum |
None, Top Left, Bottom Right, Both | Defines the positions of tick marks and text labels. |
The MCSurgu enumeration provides two different tracker
shapes: Ellipse and Rectangle.
This is the default option in the source code. The blue circular tracker shown in the user's example is consistent with this selection.
Can be used when a more angular, technical indicator style is required. It provides an appearance that works well with straight-edged screen designs.
In addition to changing the shape, the tracker's color can be
configured using TrackerColor.
Linear indicators are useful on HMI/SCADA screens where quickly recognizing the position of a numerical value within a defined range is important. Industrial HMI documentation describes similar linear indicator objects as a means of displaying numerical process values on a linear scale and moving the indicator position as the value changes.
Can be used to quickly monitor the position of a temperature value within a minimum–maximum range.
Suitable for displaying the position of a pressure value within its operating range on a compact linear scale.
Can be used to monitor tank, reservoir, or process levels as a linear position from low to high.
Enables rapid assessment of the position of continuously changing values such as flow rate on the scale.
Can be used to indicate the operating level of motor speed or other continuously variable equipment parameters.
Can be used for quickly assessing the position of numerical values such as voltage, current, and power within a defined range.
A numerical display gives the operator the exact value, while a linear display simultaneously provides a visual indication of the value's position within the range. Industrial HMI documentation also notes that linear indicators help operators quickly assess a value's state relative to limits and thresholds.
| Display Type | Basic Approach | Key Information | Relationship to MACTRACKBAR |
|---|---|---|---|
| Numerical Indicator | Displays the value directly as a number. | Exact numerical value | MACTRACKBAR adds positional information to the numerical value. |
| Bar Indicator | Represents the value through the amount of fill. | Fill / level | MACTRACKBAR focuses on the tracker's position on the scale rather than the amount of fill. |
| Circular Indicator | Displays the value using a dial and pointer. | Angular position | MACTRACKBAR applies the same principle along a linear axis. |
| Linear Indicator | Positions the value on a linear scale. | Position within the range | MACTRACKBAR is a compact user control implementing this approach. |
MACTRACKBAR is therefore particularly useful on screens where quickly answering the question "Where is the value?" is important. The operator does not simply read the number; the tracker's position on the scale also indicates whether the value is close to the lower limit, the middle of the range, or the upper limit.
Conceptually, MACTRACKBAR operates in the display layer of the SCADA screen. Numerical data received from the field or control system is visually positioned within the minimum–maximum range defined for the control.
Important distinction: This flow describes the control's visual display role. Since the supplied MACTRACKBAR source code does not contain a command or setting mechanism for writing data to a controller, its primary usage model is linear display for monitoring purposes.
LINEAR INDICATOR (MACTRACKBAR) is a SCADA user control that positions a numerical process value on a linear scale, quickly communicating to the operator where the value is located.
With features such as horizontal or vertical orientation, a minimum–maximum value range, tracker shape and color, track line, tick frequency, tick color, numerical label positions, and border style, the control can be adapted to different screen designs.
MACTRACKBAR = Linear Scale + Minimum/Maximum + Tracker + Tick Marks + Numerical Labels + Horizontal/Vertical Orientation + Visual Customization
Its most important characteristic is that it is for display purposes only: rather than writing a value to a controller, it clearly and compactly presents the position of the current process value on a linear scale.
Free Software Download Center
Software for industrial data collection, monitoring, and analysis.

Technical Support
Software documentation, sample code, and practical technical information.
You can contact us regarding EOS software, technical documentation, or industrial data communication.