LIVE SYSTEM MONITOR VIEW

The panel below is provided as an example for documentation purposes. In the actual SYSTEM_MONITOR control, the relevant information is updated on the SCADA screen according to the selected Information Name and chart settings.


TYPES OF INFORMATION THAT CAN BE DISPLAYED

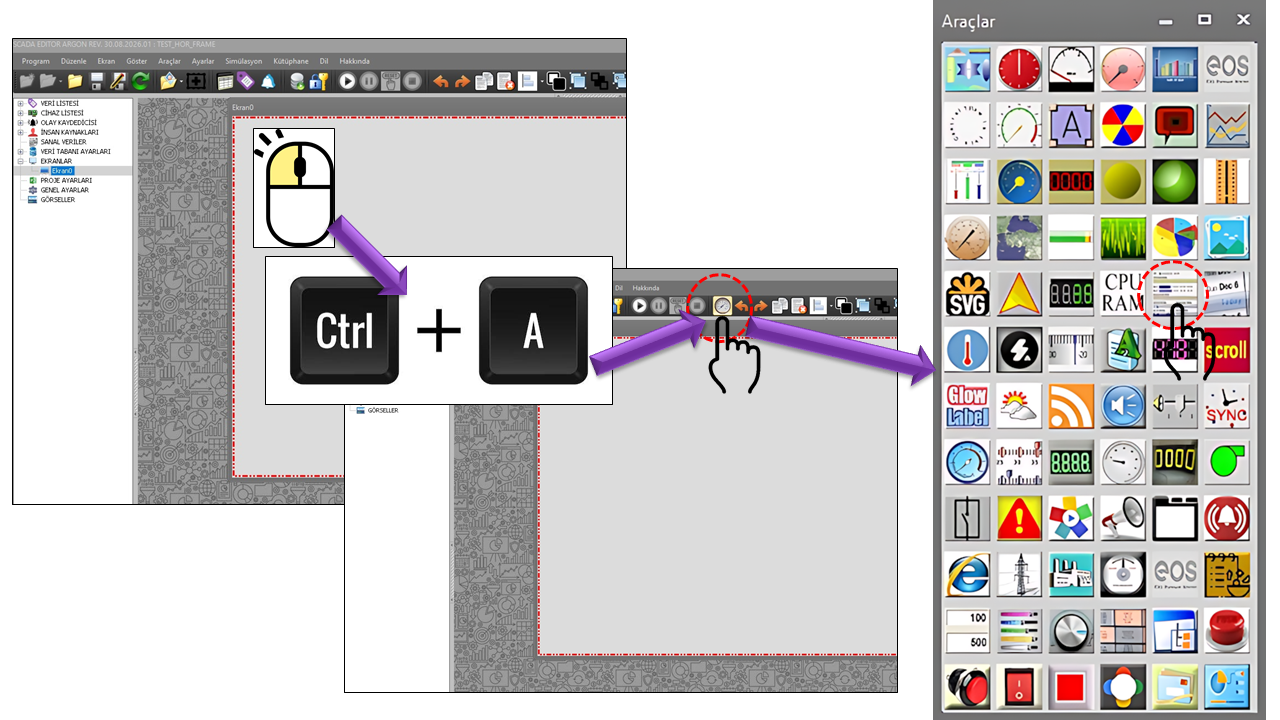
The key strength of SYSTEM_MONITOR is that it allows different types of system information to be selected within a single control. The cards below explain each SMBilgiTuru option defined in the source code. Windows system information and performance counters provide standard measurement categories for monitoring resources such as processors, memory, disks, and networks.

SYSTEM_MONITOR • SYSTEM STATUS

LIVE MONITORING
CPU USAGE
68%
Example current value
MEMORY
54%
Example current value
CONNECTION
ACTIVE
Application connection status
SCADA OPERATOR
OPERATOR-01
Example user
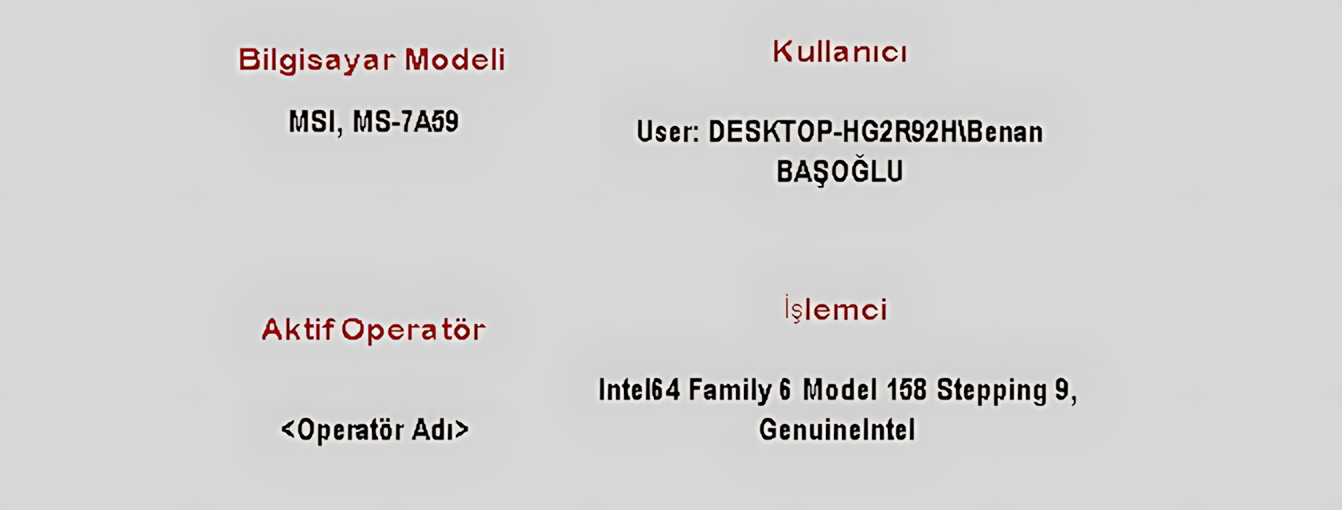
Computermodel

Computer Model

Displays the model information of the computer running the SCADA application. System information APIs can access configuration details such as computer hardware and computer name.

HardwareIdentification
Processortype

Processor Type

Displays information about the computer's processor architecture or type. Windows system information structures can provide details such as processor type and the number of processors in the system.

HardwareProcessor
User

User

Used to display user information associated with the running environment. Windows APIs support retrieving the user name associated with the current thread.

UserIdentity
Scadaoperator

SCADA Operator

Defined to display operator information in the context of the SCADA application. The supplied source code does not specify which authentication source is used to generate this information type.

SCADAOperator
Connectionstatus

Connection Status

Used to make the connection status of the SCADA runtime environment visible in an information field. The supplied source code does not detail which connection or status codes are evaluated.

StatusConnection
Cpuusage

CPU Usage

Displays processor utilization as a current system performance indicator. Windows performance counters provide a standard measurement layer for monitoring CPU usage.

Current ValuePerformance
Cpuusagehistory

CPU Usage History

Used to present changes in CPU usage over time as a graphical history. This makes it possible to monitor not only the current value but also the direction of change.

HistoryTrend
Memv

Memory V

This is the memory information type defined as Memory V in the source code. Since the exact meaning of the letter “V” within the control is not explained in the supplied code, the original source-code terminology is retained on this page.

MemoryV
Memp

Memory P

This is the second memory information type, defined as Memory P in the source code. Since the exact meaning of the letter “P” within the control is not explained in the supplied code, the technical name is preserved unchanged.

MemoryP
Memoryusagehistory

Memory Usage History

This history/trend view is intended to track changes in memory usage over time. Windows performance counters support the collection of memory usage statistics.

HistoryMemory
Diskreadhistory

Hard Disk Read History

Used to monitor changes in disk read activity over time. Disk usage statistics are a fundamental category of performance monitoring.

DiskRead
Diskwritehistory

Hard Disk Write History

Used to monitor changes in disk write activity over time. This allows write activity on the storage device to be tracked separately as a historical view.

DiskWrite
Netinhistory

Incoming Network Packet History

Displays changes over time in traffic or packet activity arriving at the network interface. Windows network performance counters include separate measurement categories for received bytes and packets.

NetworkIncoming
Netouthistory

Outgoing Network Packet History

Displays changes over time in traffic or packet activity sent out through the network interface. Windows network performance counters provide separate measurement categories for sent bytes and packets.

NetworkOutgoing

GRAPHICAL HISTORY AND LIVE VISUALIZATION

History views help users observe how system values change over time instead of reading them at just a single moment. The ChartType option in the source code determines whether the chart is displayed as a Bar or a Line chart. Windows performance counters are also a standard data collection approach used to monitor resources such as CPU, memory, disks, and networks.

Example CPU Usage History

CPU
68%
Memory
54%
Network In
42%
Network Out
27%

Visual Interpretation

Live information → sampling → history → chart → rapid operator perception. The chart values on this page are documentation examples only; they do not represent actual values.

GENERAL PROPERTIES

The table below presents the properties in your supplied SYSTEM_MONITOR source code together with their equivalents in the Türkçe_set2(3).txt dictionary. For information type names without a direct equivalent in the dictionary, the descriptions in the source code have been used.

PROPERTY EOS TURKISH EQUIVALENT DEFAULT DESCRIPTION
UCType Control Type SYSTEM_MONITOR Defines the type of the user control.
UpdateInterval Update Interval 10000 Specifies the interval at which the control refreshes system information, in milliseconds.
DecimalPoint Decimal Places 0 Specifies the decimal-place setting for displaying numerical values.
UCBackColor Control Background Color Transparent Specifies the background color of the control.
UCForeColor Control Text Color Black Specifies the color of the text in the control.
UCFont Control Font Arial Narrow, 8.25f Specifies the font used within the control.
InformationName Information Name Computermodel Specifies the SMBilgiTuru option to be displayed by the control.
ChartBorderStyle Chart Border Style None Specifies the border appearance of the chart area.
GridColor Grid Color Yellow Specifies the color of the grid or guide lines on the chart.
GridPixels Grid Pixels 0 Specifies the pixel-based setting for the chart grid.
LineColor Line Color DarkBlue Specifies the line color used in line-chart displays.
ChartType Chart Type Stick Specifies whether the chart is displayed as bars or a line.
InitialHeight Initial Height 1000 Specifies the initial height value for the chart or display area.
BarColor Bar Color DarkBlue Specifies the bar color used in bar-chart displays.
BorderType Border Type None Specifies the type of the control border.
HeaderBackColor Header Background Color Transparent Specifies the background color of the header area.
HeaderForeColor Header Text Color Black Specifies the text color in the header area.
HeaderFont Header Font Arial Narrow, 8.25f Specifies the font used in the header area.
ShowHeader Show Header false Determines whether the header area is displayed.

OPTION SETS

The enum structures in the source code are presented below using an Option Sets approach rather than as direct enum lists.

SMBilgiTuru • Information Types

This is the set of information types available for selection through the control's InformationName property.

Computer ModelProcessor TypeUserSCADA OperatorConnection StatusCPU UsageCPU Usage HistoryMemory VMemory PMemory Usage HistoryHard Disk Read HistoryHard Disk Write HistoryIncoming Network Packet HistoryOutgoing Network Packet History

GNCerceveTuru • Border

This is the set of options provided for ChartBorderStyle and BorderType.

NoneSingle FixedFixed 3D

SMCizgiTuru • Chart

This is the set of options that determines the chart display for the ChartType property.

BarLine

SYSTEM_MONITOR OPERATING PRINCIPLE

The control works by retrieving the selected information type from the system and presenting it visually within the update interval. For history types, the graphical representation of changes is the main focus.

SELECTIONInformation Name
SYSTEMInformation source
UPDATE10000 ms
CHARTBar / Line
OPERATORQuick monitoring

Technical Assessment

Windows performance counters are not designed for high-frequency data collection; Microsoft does not recommend collecting them more frequently than once per second. Therefore, the UpdateInterval=10000 ms value specified for SYSTEM_MONITOR represents a 10-second update interval in your source code, and this value has been retained in the documentation example.

SCADA APPLICATION AREAS

SYSTEM_MONITOR can be used on screens where technical visibility into the system itself is needed alongside process displays. The application areas below are example scenarios derived from the information types defined for the control.

Main Operator Screen

Information such as CPU usage, memory, and connection status can be displayed in a compact technical status area.

Technical Monitoring

Changes in system behavior can be tracked graphically through CPU, memory, disk, and network histories.

Communication Monitoring

Incoming and outgoing network packet histories can provide information areas for visual monitoring of communication traffic.

Operator Information

User and SCADA operator information can make the current operating context of the screen visible.

Disk Activity

Disk read and write histories can help monitor storage-device activity separately.

Visual Overview of System Health

The ability to select multiple information types within a single control makes it easier to bring technical status information onto the SCADA screen.

TECHNICAL REFERENCES

The following Microsoft Learn resources were consulted for general technical background on system information and Windows performance measurements.

CONCLUSION

SYSTEM_MONITOR is a user control that can extend the SCADA screen beyond process data by making the technical status of the computer and runtime environment visible. Its most important feature is the ability to select different types of system information through InformationName / Information Name.

Alongside current CPU and memory information, the control handles different categories of information within the same structure, including user and operator information, connection status, CPU and memory history, disk read/write history, and network traffic history. On the chart side, the Bar and Line options allow different visual representations to be created.

Key Concept

System information → live update → history → graphical display → technical visibility on the SCADA screen.

Documentation Note

The technical names and default values of the user control properties on this page are taken directly from the supplied SYSTEM_MONITOR source code. The Türkçe_set2(3).txt dictionary was used as the basis for the Turkish property equivalents. Explanations of Windows system information and performance are supported by Microsoft Learn resources. Behaviors not explained in the source code have not been presented as confirmed features.