
Free Software Download Center
Software for industrial data collection,
monitoring and analysis.
INDUSTRIAL SHAPE LIBRARY • DATA-DRIVEN VISUALIZATION • DYNAMIC ANIMATION
The industrial shape library included in EOS SCADA allows field equipment and process elements to be visualized on SCADA screens in a realistic and understandable manner.
More than 4,000 industrial shapes available in the library can be placed on the screen through the INDUSTRIAL_LED user control and associated with SCADA data.
Based on the value of the associated data, dynamic visual behaviors such as changing the shape color, displaying a different shape, or making the shape blink can be created.

Displaying only numerical values on SCADA screens may not always make it easy for the operator to quickly understand the process.
Graphically representing field equipment such as motors, pumps, valves, turbines, generators, circuit breakers and similar equipment makes process information easier to understand at a glance.
EOS SCADA provides an industrial shape library containing a large number of ready-to-use industrial shapes for this purpose. Users can add these shapes to SCADA screens through the INDUSTRIAL_LED user control.
INDUSTRIAL_LED is not limited to displaying a static shape. Depending on the state of the SCADA data associated with the control, visual behaviors such as color changes, shape changes and blinking can be created to dynamically display the operating status of the equipment.
To add industrial shapes to a SCADA screen, the relevant project must first be opened in the EDITOR software.
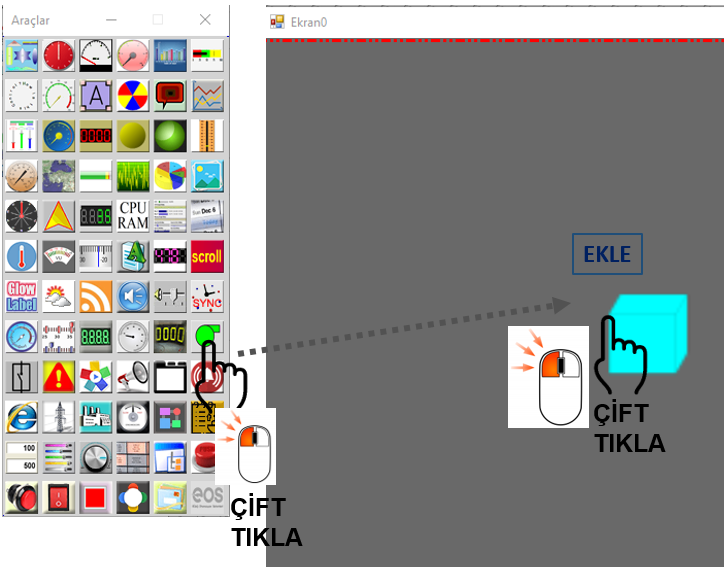
 Place the control on the screen.
Double-click again on the
INDUSTRIAL_LED insertion cursor
that appears on the screen to add the user control
to the screen.
Place the control on the screen.
Double-click again on the
INDUSTRIAL_LED insertion cursor
that appears on the screen to add the user control
to the screen.
The behavior of the INDUSTRIAL_LED user control added to the screen can be configured in detail using the parameters available in the properties section.
| Property Name | Property Description | Default Value |
|---|---|---|
| AlarmType | Determines how the industrial shape behaves according to data states. | Colored |
| BlinkRate | Determines the blinking rate. | 1000 |
| RotationAngle | Determines the rotation angle of the shape. | Zerodegrees |
| XFlip | Flips the shape along the X axis. | false |
| YFlip | Flips the shape along the Y axis. | false |
| UsePreciseRotation | Enables the use of a precise rotation angle. | false |
| PreciseAngle | Determines the precise rotation angle. | 0 |
| ColorAutoSelect | Enables automatic color selection. | false |
| RedComponent | Determines the red component of the color. | 175 |
| GreenComponent | Determines the green component of the color. | 175 |
| BlueComponent | Determines the blue component of the color. | 175 |
| PixelTreshold | Determines the pixel threshold. | 100 |
| UCBackColor | Determines the background color of the user control. | Transparent |
| UCForeColor | Determines the foreground/text color of the user control. | Black |
| DefaultImageFileName | Determines the name of the external image file to be used by default. | - |
| DefaultLibraryImage | Determines the default shape to be used from the library. | - |
| DefaultImage | Determines the default image. | - |
| UseFillColor | Enables the use of a fill color for the shape. | false |
| FillColor | Determines the fill color of the shape. | Lime |
| SHAPEDataStates | Defines the state levels to be created according to data values. | - |
Industrial shapes can be used with INDUSTRIAL_LED through two basic visualization methods. The AlarmType property determines how this behavior is implemented.
Colored: The color of the industrial shape is changed according to the state levels defined for the data.
Shapechange: The displayed industrial shape is changed according to the state levels defined for the data.
In this way, the same equipment symbol can represent different operating states of the process either by changing only its color or by using different shapes.
Different data levels can be created under SHAPEDataStates to determine how the industrial shape behaves according to the data value.
Each data level can have a specific threshold value. When the data value satisfies the condition of the relevant level, the color, shape and blinking properties associated with that level are applied.
| Property Name | Property Description | Default Value |
|---|---|---|
| LevelBackColor | Determines the background color of the data level. | White |
| LevelForeColor | Determines the foreground/text color of the data level. | Black |
| LevelThreshold | Determines the threshold value of the data level. | 10 |
| BlinkActive | Determines whether blinking behavior is enabled for the relevant data level. | false |
| ImageFileName | Determines the name of the external image file to be used for the data level. | - |
| LibrarySelectedImage | Determines the ID of the library shape to be used for the data level. | - |
Important: There is no fixed number of data levels. Users can define as many data levels as required according to the needs of the process.
For example, three different data levels can be created to indicate the operating status of a piece of equipment.
With this structure, the operator can quickly determine the operating level of the equipment simply by looking at the color of the shape.
When the same structure is used with the Shapechange option, a different industrial shape can be displayed for each data level instead of changing the color.
The shapes used within INDUSTRIAL_LED can be obtained from two different sources.
Using the library makes it particularly easy to represent equipment such as pumps, motors, valves, generators and turbines using standardized symbols. Using an external image, on the other hand, allows project-specific graphics or custom graphics that are not available in the library to be used on SCADA screens.
With INDUSTRIAL_LED, not only color or shape changes but also blinking behavior based on the data state can be created.
To enable this behavior, the BlinkActive property is enabled for the relevant data level. The blinking rate can be determined using the BlinkRate parameter.
This feature provides an effective visual warning mechanism, particularly for alarms, critical operating conditions, or situations where the operator's attention needs to be drawn quickly.
CAUTION: Strong visual warnings such as blinking should be used only for important conditions that require the operator's attention. If too many controls continuously blink, the readability and usability of the operator interface may be negatively affected.
The EOS SCADA INDUSTRIAL_LED user control is an advanced visualization tool that enables industrial shapes to be used on SCADA screens and associated with real-time data.
Users can select from more than 4,000 industrial shapes available in the library or use their own image files.
The Colored option can be used to change the color according to the data value, the Shapechange option can be used to change the shape, and the BlinkActive property can be used to create blinking behavior.
By combining these features with the data levels defined under SHAPEDataStates, SCADA screens can be transformed from interfaces consisting only of static graphics into dynamic operator screens that visually reflect the actual state of the process.
Free Software Download Center
Software for industrial data collection,
monitoring and analysis.

Technical Support
Documentation, sample code and
practical information for the software.
You can contact us regarding EOS SCADA, software or technical content.